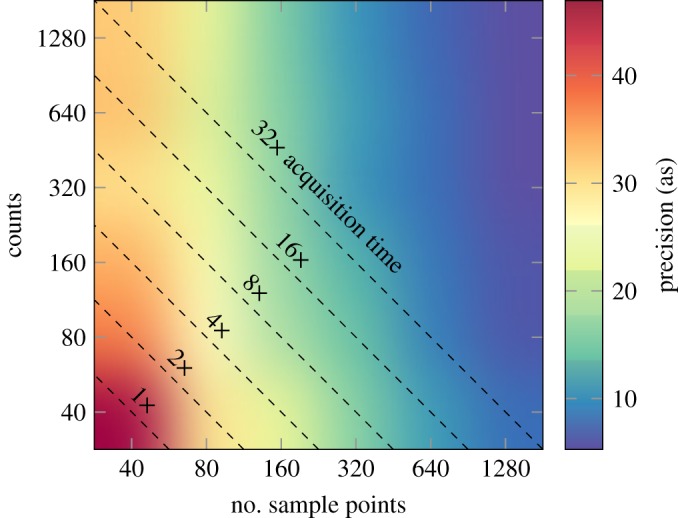
Figure 9.

RABBIT precision as a function of number of sampling points and maximum allowed sideband oscillation measured in counts. Each diagonal line represents a line of constant acquisition time in a real experiment. The simulations were run with a jitter of 50 as, including statistical noise and a background level of 10%.
