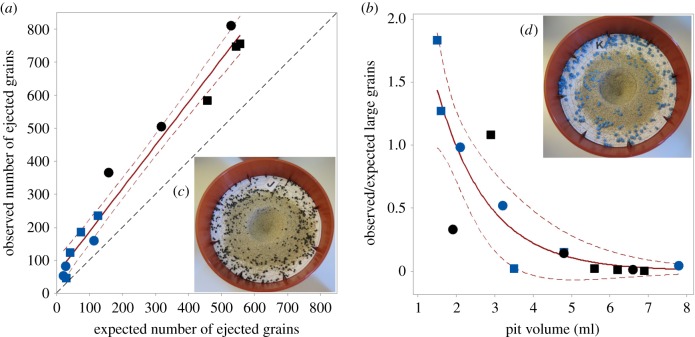
Figure 2.
Experimental results. (a) Relationship between the observed number of ejected large grains and their expected number based on the substrate mixture and unbiased ejection; blue (black): 1–2 mm (1.5–3 mm) in diameter; dashed black line: line of equality; the y-difference between the regression line and the line of equality represents the number of observed large grains in excess of expected number. (b) Relationship between the ratio of the observed to the expected number of large grains (blue and black) in the pit wall and pit volume; circle (square): 20% (30%) volume fraction of large grains; solid red line: regression line, dashed red lines: 95% confidence interval for the regression line. Three and two of the 16 antlions were not included in (a) and (b), respectively, because they performed little or no pit building. (c–d) Experimental pot with a paper annulus over a mixture of silver sand and large black (blue) grains; the pit is in the middle of the hole in the paper annulus; small paper labels ‘J’ and ‘K’: pot IDs.

