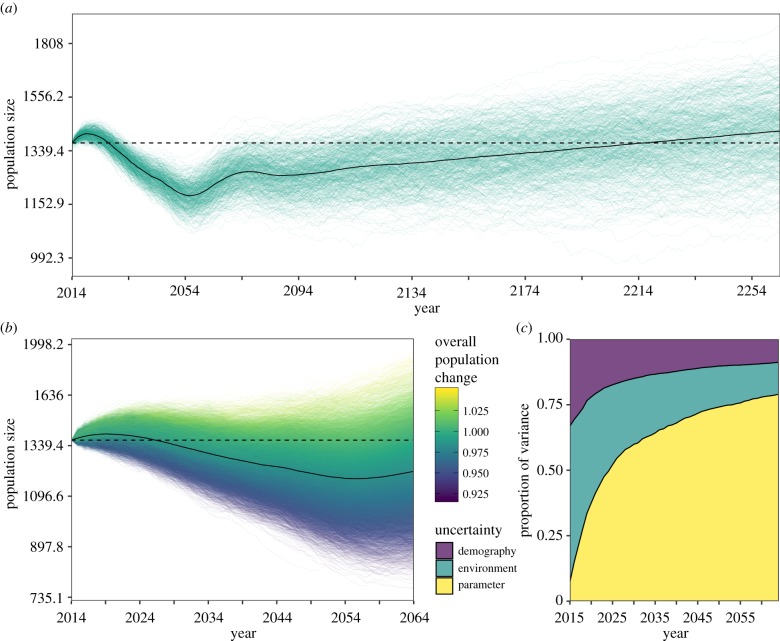
Figure 3.
Population projections for female timber elephants in a world without wild-capture. (a) Population projection over 250 years and 500 simulations representing the average dynamics of the population excluding model uncertainty in parameters and environmental stochasticity. Green lines represent the change in population size for each simulation, and the solid black line indicates the geometric mean. (b) Short-term changes (50 years) in the timber elephant population incorporating varying levels of uncertainty (parameter uncertainty and demographic/environmental stochasticity). Coloured lines indicate each simulation (20 000), and the colour denotes the overall population change in that simulation. Solid black line indicates the geometric mean of population size. For population projections, population size is on the natural log scale, and the dashed line indicates the starting population of 1369. (c) The proportion of variance in ln(population size) explained by uncertainty in model parameters (yellow), and with both environmental (green) and demographic (purple) stochasticity over 50 years for 20 000 simulations.

