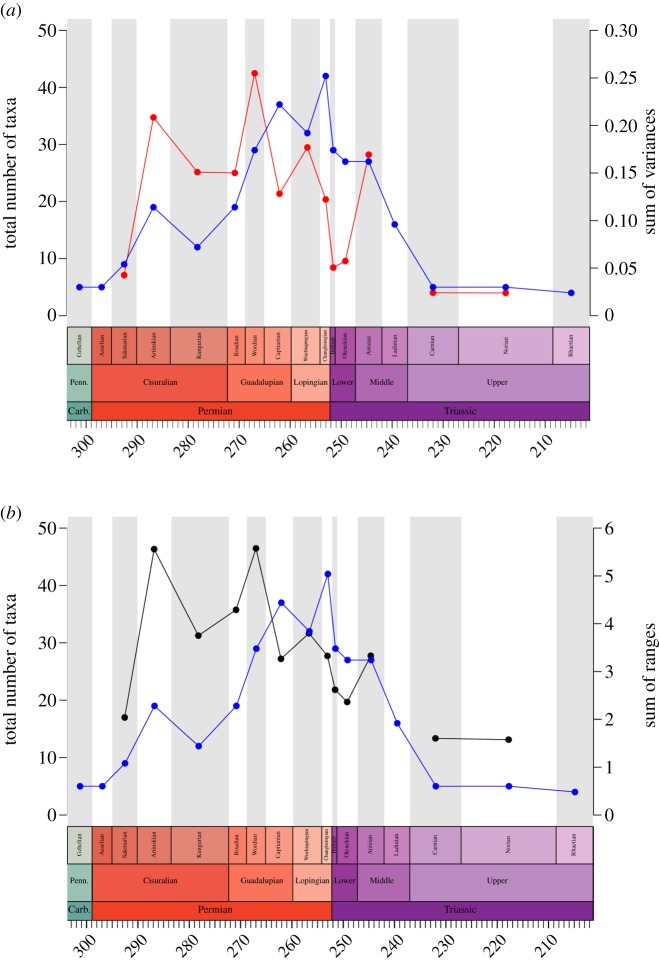
Figure 2.
Plot illustrating changes in parareptile species richness and disparity through time. (a) Richness curve (blue) plotted with the disparity curve produced by the sum of variances (red), and (b) richness curve (blue) plotted with the disparity curve produced by the sum of ranges (black). Stratigraphic stages are used as time intervals. (Online version in colour.)

