
Figure 2.
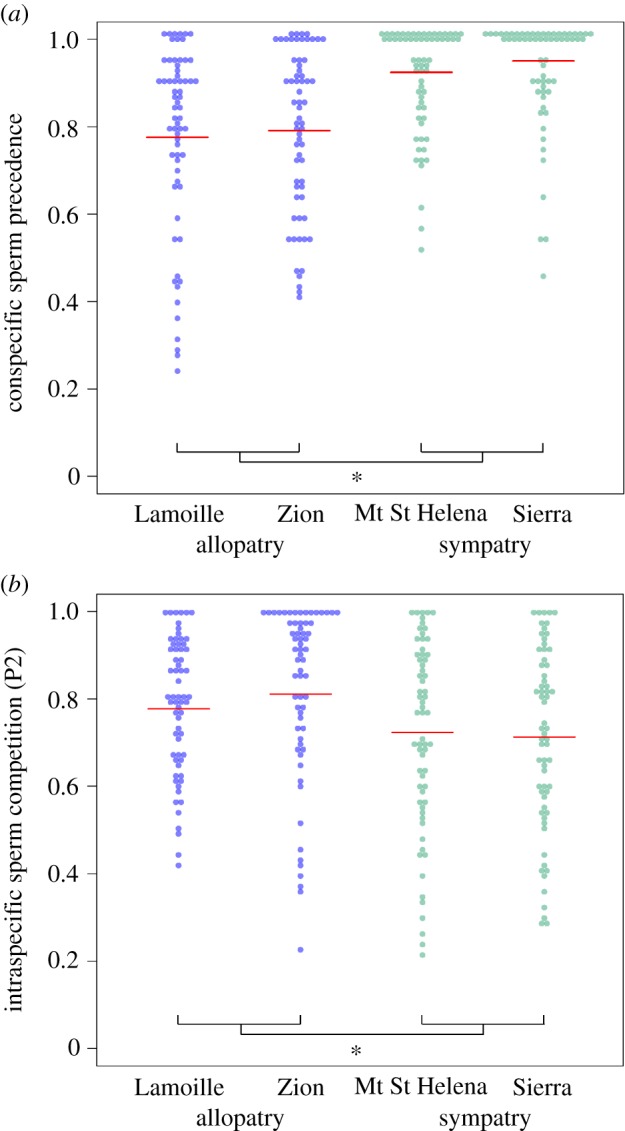
The phenotypic distributions of CSP (a) are consistent with a pattern of reinforcement. The distribution of ISC (b) shows a shift in ISC in the opposite direction compared to CSP for sympatric populations. CSP is defined as the proportion of progeny sired by the D. pseudoobscura male competing against a previously mated D. persimilis male. ISC is defined as the progeny sired by a D. pseudoobscura male competing against a previously mated D. pseudoobscura male. The red line in each distribution represents the mean value. Significant differences determined by Welch's t-test and Wilcox tests between the allopatric and sympatric populations are denoted by *.