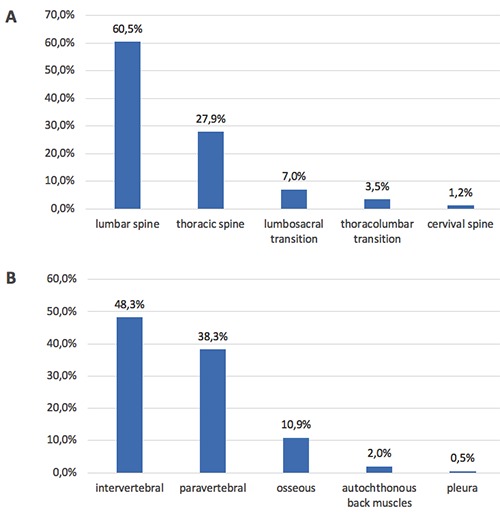
Figure 3.

Graphical illustration of anatomical regions (A) and exact puncture sites (B) of CT-guided interventions. A) Location of puncture during CT-guided biopsies (height of vertebral column). B) Location of puncture during CT-guided biopsies (target tissue).
