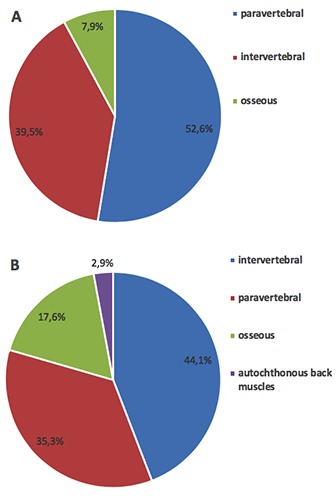
Figure 5.

Graphical illustration of location of puncture sites and rates of positive (A) and negative (B) histopathological results. A) Location of puncture sites of biopsies with positive histopathological findings. B) Location of puncture sites of biopsies with negative histopathological findings.
