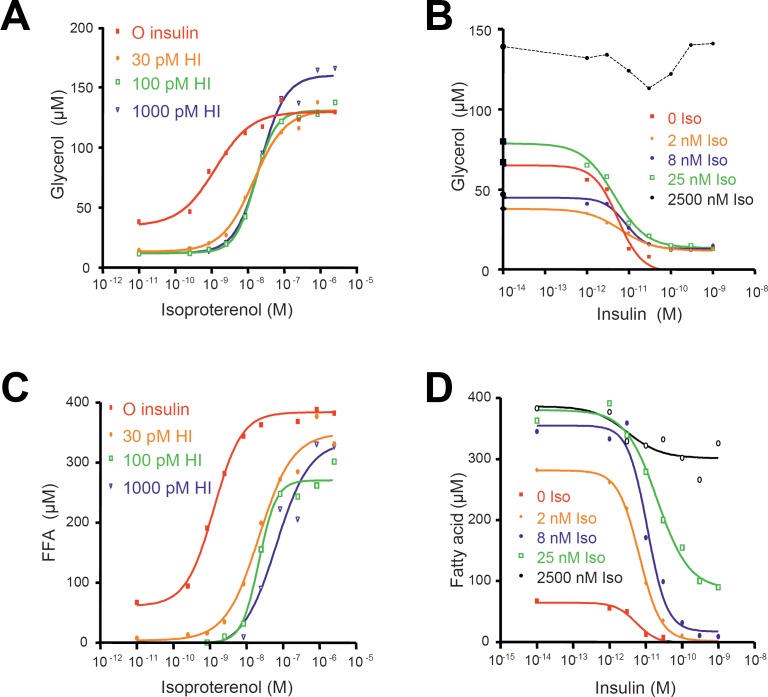
Fig. 4.
Glycerol (A, B) and fatty acid mobilization (C, D) from SGBS adipocytes in response to different combinations of isoproterenol and insulin. (A, C) dose-response curves for isoproterenol at fixed insulin concentrations. (B, D) dose-response curves for the inhibitory effect of insulin at fixed isoproterenol concentrations.

