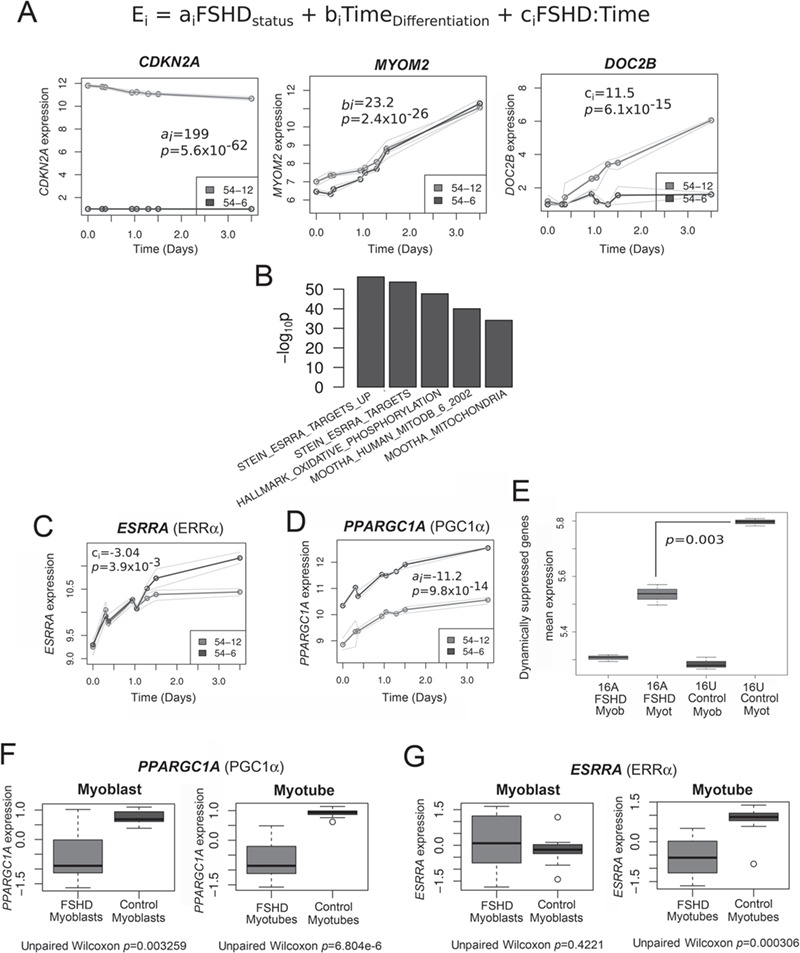
Figure 3.

Transcriptomic analysis of FSHD myogenesis reveals suppression of PGC1α and ERRα. (A) A multivariate regression model was fit to the time course RNA-seq data describing the control 54-6 and FSHD 54-12 myoblasts during myogenesis. Coefficient ai attains positive values if gene i is up-regulated in FSHD versus controls and negative values if down-regulated. Coefficient bi attains positive values if gene i is up-regulated during myogenic differentiation and negative values if down-regulated. Coefficient ci attains positive values if gene i is up-regulated during differentiation in FSHD and negative values if down-regulated. As an example, time course expression plots are shown for the genes with the highest coefficient values for coefficient ai (CDKN2A), bi (MYOM2) and ci (DOC2B), where thick lines represent mean expression across triplicates and thin lines denote maximum and minimum expression values observed across triplicates. (B) Bar plot displays log10 enrichment P-values for the top 5 enriched gene sets among the 500 genes with the most negative ci coefficient (i.e. those suppressed in FSHD myogenesis). We see clear enrichment for target genes of ERRα and genes involved in mitochondrial processes. (C) Expression of ESRRA (ERRα) in FSHD 54-12 and matched control 54-6 myoblasts from RNA-seq analysis. Significant repression in FSHD myogenesis begins from day 1 of differentiation. Thick lines represent mean expression across triplicates and thin lines denote maximum and minimum expression values observed across triplicates. (D) Expression of PPARGC1A (PGC1α) in FSHD 54-12 and matched control 54-6 myoblasts from RNA-seq analysis. Significant repression in FSHD myoblasts occurs at all time points analysed. Thick lines represent mean expression across triplicates and thin lines denote maximum and minimum expression values observed across triplicates. (E) The 500 genes with the most negative ci coefficient (i.e. those suppressed in FSHD myogenesis) identified in the data set of the FSHD 54-12 and control 54-6 myoblasts were tested on RNA-seq data from FSHD 16Abic and control 16Ubic at time 0, confluent myoblasts (myob) and time 5040 min, mature myotubes (Myot). Box-plots demonstrate that the mean expression of these 500 genes with the most negative ci coefficient was also significantly lower in 16Abic FSHD myotubes versus 16Ubic control myotubes. The box represents the interquartile range (IQR), with the median indicated by a line. Whiskers denote min [1.5*IQR, max (observed value)]; values were tested using an unpaired two-tailed t-test. (F) Expression of PPARGC1A (PGC1α) is suppressed in RNA-seq from FSHD 16Abic, 12Abic, 54-2 and 54-A5 cell lines at both time 0, confluent myoblasts and time 5040 min, mature myotube stage, compared to control 16Ubic, 12Ubic, 54-A10 cell lines. The box represents the IQR, with the median indicated by a line. Whiskers denote min [1.5*IQR, max (observed value)]; values were z-normalised within FSHD-control groups and tested using an unpaired Wilcoxon test. (G) Expression of ESRRA (ERRα) is suppressed only in RNA-seq from FSHD 16Abic, 12Abic, 54-2 and 54-A5 cell lines at the time 5040 min mature myotube stage, compared to control 16Ubic, 12Ubic and 54-A10 cell lines. The box represents the IQR, with the median indicated by a line. Whiskers denote min [1.5*IQR, max (observed value)]; values were z-normalised within FSHD-control groups and tested using an unpaired Wilcoxon test.
