
Figure 4.
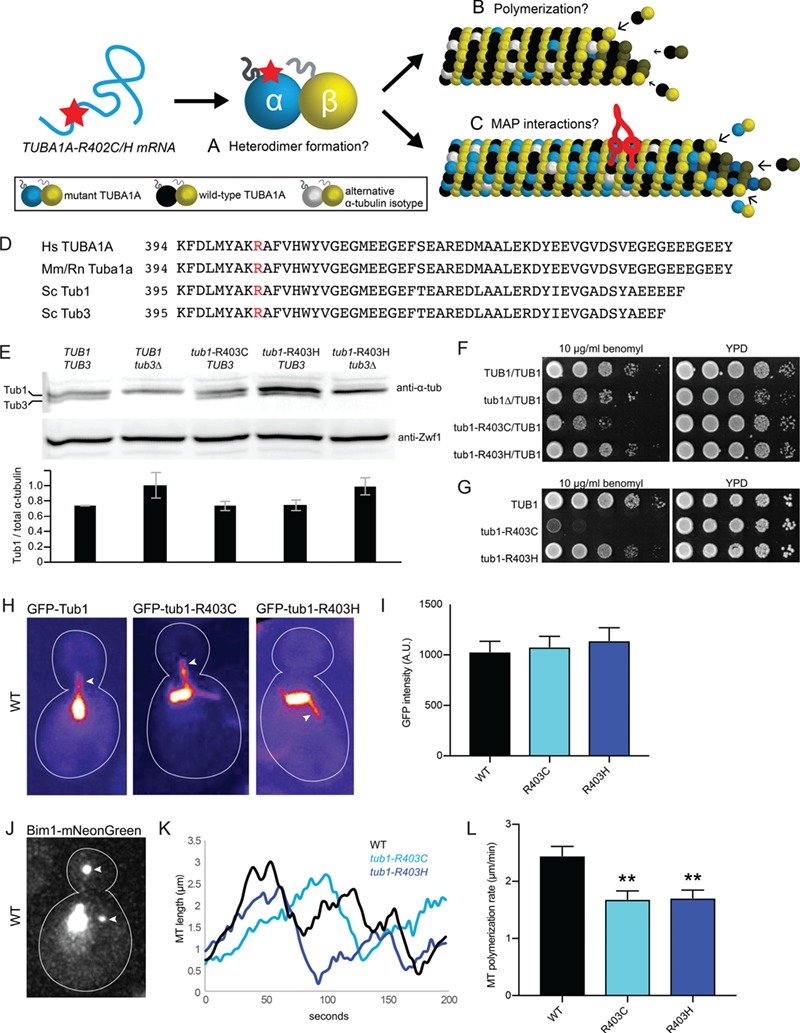
α-tubulin R402C/H mutants form polymerization-competent tubulin heterodimers in Saccharomyces cerevisiae. (A–C) Possible consequences of α-tubulin R402C/H mutants on tubulin function. R402C/H mutants may disrupt tubulin heterodimer formation (A), polymerization into microtubule lattice (B) and/or microtubule-associated-protein interactions (C). (D) Amino acid alignment of α-tubulin protein C-terminal region with conserved arginine of interest in red. Hs, Homo sapiens; Mm, Mus musculus; Rn, R. norvegicus; Sc, S. cerevisiae. (E) Western blot of α-tubulin protein in lysates from the indicated strains. Blots were also probed for Zwf1/G6PD as a loading control. Intensity of α-tubulin bands from three separate experiments, normalized to Zwf1 loading control. Data are represented as mean ± SEM. Strains: WT, yJM596; tub3∆, yJM0103; tub1-R403C, yJM2240, yJM2245; tub1-R403H, yJM2121, yJM2263; tub1-R403H tub3∆, yJM2533. (F) Growth assay for heterozygous diploid tub1-R403 mutants on rich media or rich media supplemented with the microtubule-destabilizing drug, benomyl, (10 μg/ml), incubated at 30°C. Strains: WT, yJM0091; tub1∆/TUB1, 0591; tub1-R403C/TUB1, yJM2364, yJM2365; tub1-R403H, yJM2366, yJM2367. (G) Growth assay for haploid tub1-R403 mutants grown on rich media or benomyl-supplemented rich media (10 μg/ml), incubated at 30°C. Strains: WT, yJM1839, yJM1840; tub1-R403C, yJM2120, yJM2239; tub1-R403H, yJM2121, yJM2122. (H) Images of microtubules labeled with GFP-Tub1, GFP-tub1-R403C or GFP-tub1-R403H. Arrows point to astral microtubules. (I) Quantification of GFP signal per micron of astral microtubule. At least 29 microtubules were measured for each strain. Data are represented as mean ± SEM. Strains: WT GFP-TUB1, yJM1237, yJM1887, yJM0562; GFP-tub1-R403C, yJM1872, yJM2112, yJM2113; GFP-tub1-R403H, yJM1873, yJM2114, yJM2115. (J) Image of a WT cell expressing Bim1-mNeonGreen. Arrows point to astral microtubule plus ends. (K) Representative life plots of astral microtubule dynamics in WT, tub1-R403C and tub1-R403H mutants. Astral microtubule length was measured over time as the distance between Bim1-mNeonGreen at the microtubule plus end and the minus end at the proximal spindle pole. (L) Mean polymerization rates. Data are represented as mean ± SEM. Double asterisks indicate significant difference compared to WT, by t-test (P < 0.01). Strains: WT, yJM2188, yJM2189; tub1-R403C, yJM2190, yJM2191; tub1-R403H, yJM2192, yJM2193.