Figure 5.

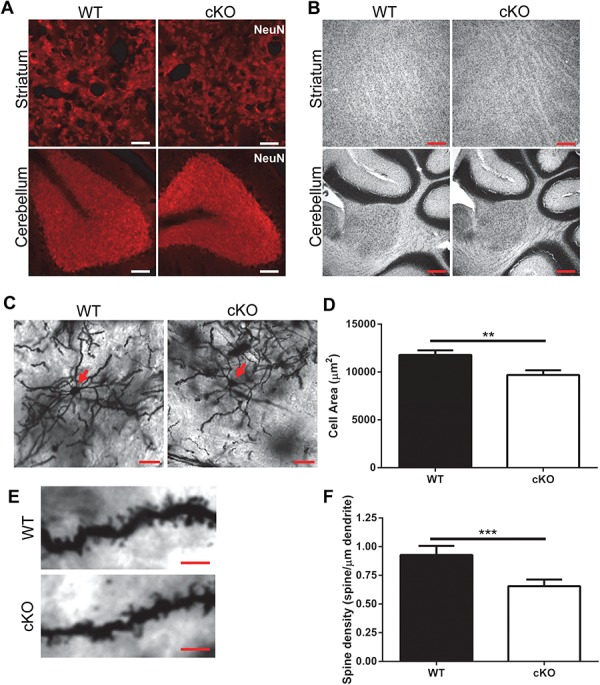
Decreased dendritic arborization and spine density in striatal MSNs in Thap1 cKO mice. (A) NeuN immunostaining in STR and CB of wild-type and Thap1 cKO mice (scale bar: 50 μm). (B) Nissl staining of STR and CB of wild-type and Thap1 cKO mice (scale bar: 200 μm). (C) Representative images of Golgi-Cox stain of striatal MSNs, red arrow pointing to soma (scale bar: 20 μm). (D) Quantification of cell size. Cells were sampled from 10 independent sections per mouse (n = 3 pairs of mice, error bars SEM, unpaired t-test; **P < 0.001). (E) Representative images of spine morphology (scale bar 5: μm) and (F) quantification of spine density, average with error bars representing SEM, 10 cells per section with 10 sections per mouse were quantified from 3 mice of each genotype (n = 3, unpaired t-test; ***P < 0.0001).
