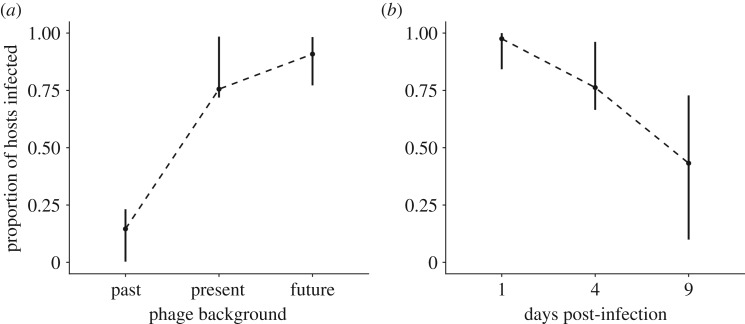
Figure 3.
Results from time-shift experiment. (a) Proportion of hosts infected when phage were from the host's past, present or future. (b) Proportion of hosts infected by phage from the same time point (days post-infection). The dotted line is for illustrative purposes. Means are shown. 95% CIs represent the variation of the mean among replicates (n = 100 048).

