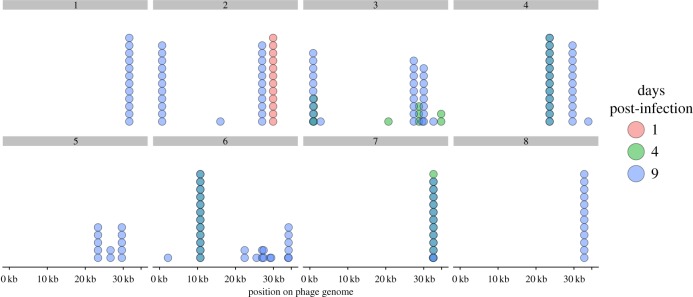
Figure 5.
Locations of newly acquired spacers on the phage 2972 genome. Histogram showing the location of acquired spacers in each replicate when mapped against the phage 2972 genome. Each dot represents a clone that had a spacer mapped to that region. Red, green and blue indicate 1, 4 and 9 days post-infection, respectively. Darker colours are the result of the visual overlap between dots. Replicate identity is indicated above each sub-panel.

