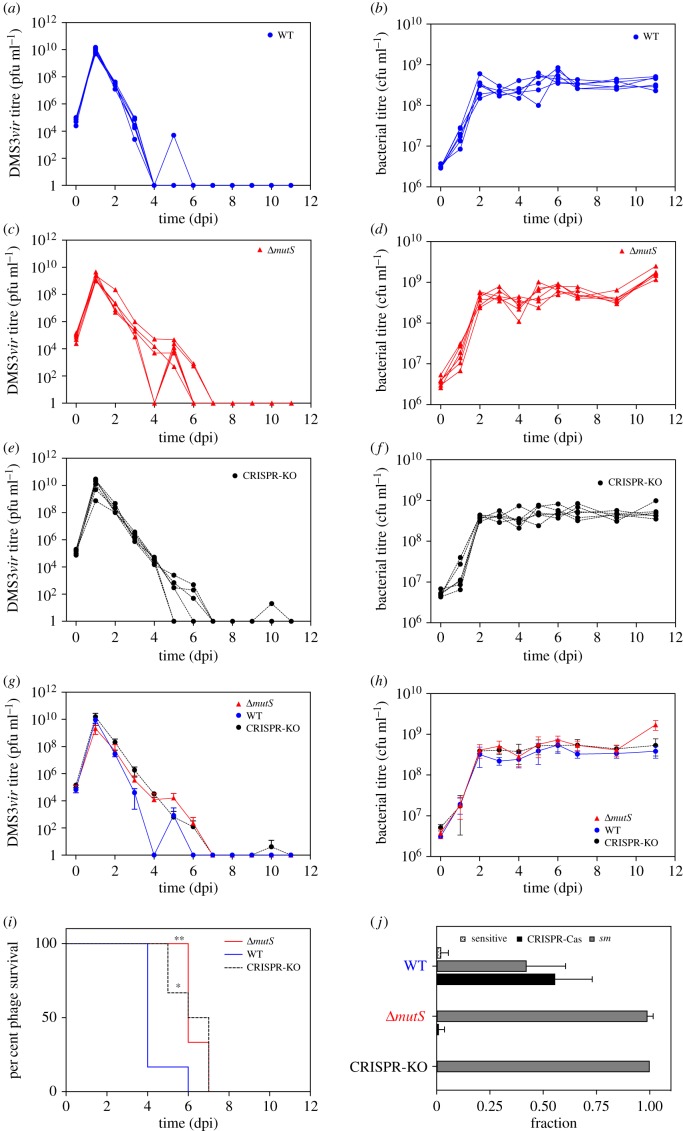
Figure 1.
DMS3vir viral titre from 0 to 11 dpi of PA14 WT (a), PA14 ΔmutS (c) or PA14 CRISPR-KO (e) hosts. Bacterial titres during the course of the experiment were also measured for the same hosts (b), (d) and (f), respectively. The average (N = 6) phage (g) and bacterial (h) titres are displayed with error bars that represent 95% confidence intervals (CI). (i) Survival analysis of phage in different host backgrounds over the course of the experiment. (j) The immunity profile for each host at 3 dpi, showing the proportion of bacterial clones that evolved resistance by surface modification (sm) or CRISPR-Cas as well as those that did not evolve resistance (sensitive). Error bars represent 95% CI.

