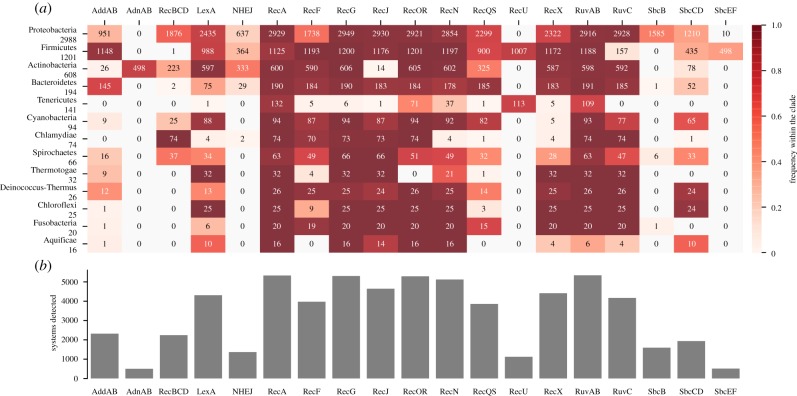
Figure 1.
Distribution of DSB-RS in bacterial genomes. (a) The distribution of the components (x-axis) in the bacterial phyla with most sequenced genomes. Clades are ordered by number of genomes present in the dataset which are indicated on the y-axis. The number in the cells represents the number of detected elements and the colour indicates their frequency in the clade. (b) The total number of components detected in the dataset.

