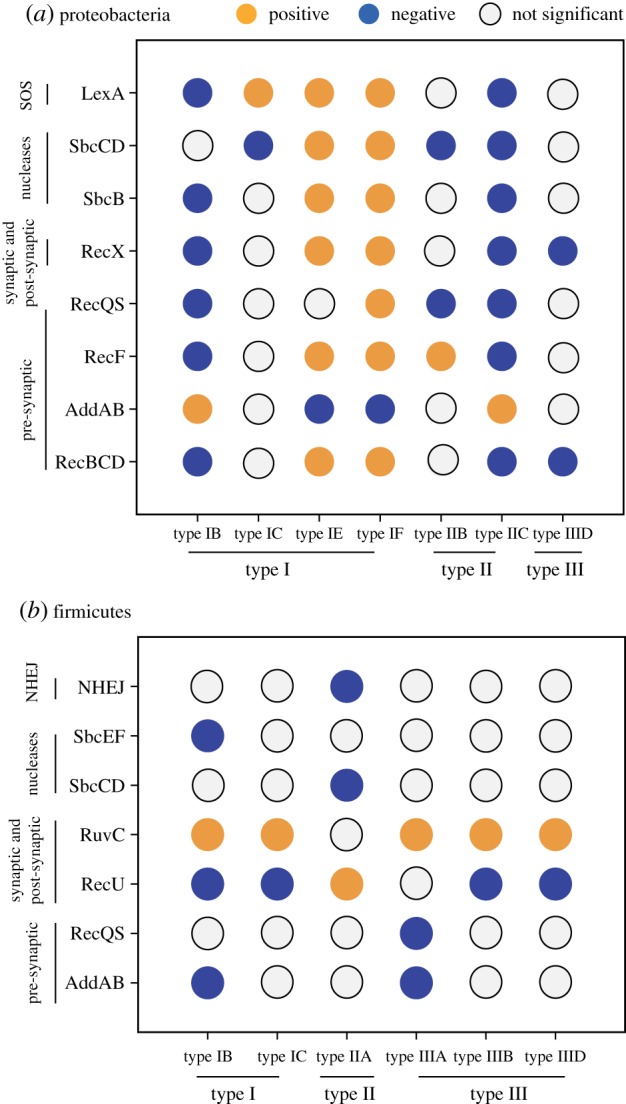
Figure 2.

Associations between CRISPR-Cas systems and DSB-RS in Proteobacteria (a) and Firmicutes (b). Each circle corresponds to the association between a CRISPR-Cas system on the x-axis and a DSB-RS component in the y-axis. Colour code: no significant association (grey), negative association (blue) and positive association (orange). Association was tested by a Fisher exact test p < 0.05 with a Bonferroni correction followed by the phylogenetic dependence test using the median of 100 likelihood ratio tests (if median lower than 0.01). Only systems present in more than 1% and in less than 99% of the total number of genomes in the clade and presenting at least one significant association are represented.
