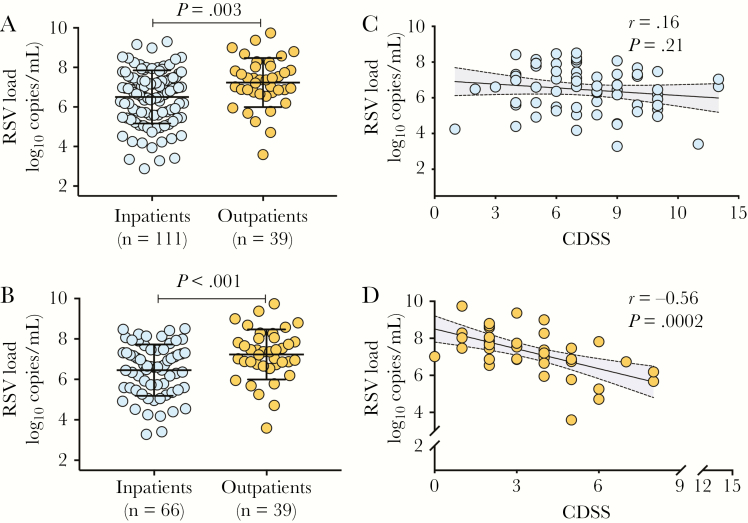
Figure 1.
Comparison of respiratory syncytial virus (RSV) loads in children with mild or severe RSV infection. A, Nasopharyngeal swabs were obtained at enrollment, and RSV loads quantitated by polymerase chain reaction were compared between children requiring hospitalization (n = 111, blue dots) and those evaluated in the outpatient setting (n = 39; orange dots). B, Comparative analyses in RSV loads between inpatients and outpatients were adjusted for age, and 2 inpatients were matched for each outpatient. Graphs represent mean ± standard deviation and comparisons were made using Student t test (P < .05 considered significant). C, Correlations between the Clinical Disease Severity Score (CDSS) and RSV loads at enrollment in the age-matched inpatient cohort (n = 66). D, Correlation between CDSS and RSV loads at enrollment in outpatients. Each dot represents an individual patient. Abbreviations: CDSS, Clinical Disease Severity Score; RSV, respiratory syncytial virus.

