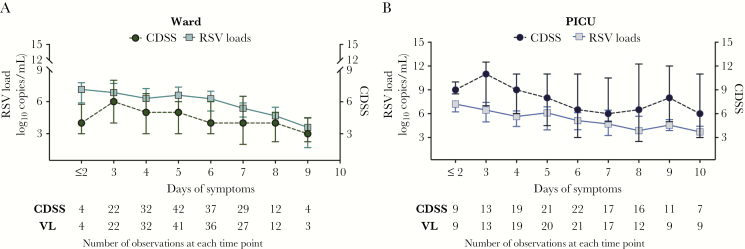
Figure 2.
Respiratory syncytial virus (RSV) dynamics and disease severity in hospitalized patients according to duration of illness and admission unit. Graphs represent the natural course of RSV bronchiolitis (viral load [VL] and Clinical Disease Severity Score [CDSS] dynamics) according to days of symptoms at the time of sampling, and not adjusted mathematically; ie, VLs measured on day 2 of hospitalization for a patient with 4 days of symptoms at the time of hospital admission would be plotted as day 6 of illness (4 days before hospitalization + 2 days of hospitalization). Children hospitalized in the inpatient ward are represented in green (A) and in the pediatric intensive care unit (PICU) in blue (B). Values for the CDSS and RSV loads represent median (interquartile range). Abbreviations: CDSS, Clinical Disease Severity Score; PICU, pediatric intensive care unit; RSV, respiratory syncytial virus; VL, viral load.

