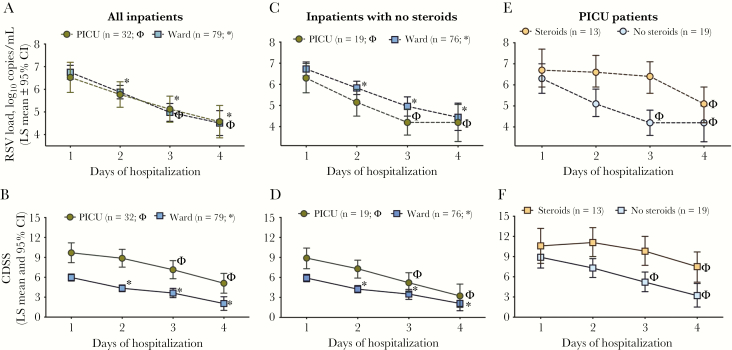
Figure 3.
Respiratory syncytial virus (RSV) dynamics and disease severity in hospitalized patients according to days of hospitalization. A and B, Linear mixed-effects model analyses in hospitalized patients were used to analyze viral load (VL) and Clinical Disease Severity Score (CDSS) decline over time according to day of hospitalization and adjusted for days of symptoms. Symbols (* for ward and Φ for pediatric intensive care unit [PICU]) represent a significant decline (P < .05) for that specific day compared with day 1 of hospitalization (baseline). Rate of decline, exact values, and interactions are specified in Supplementary Table 4. C and D, VL and CDSS decline over time according to day of hospitalization and adjusted for days of symptoms among hospitalized patients in the ward or PICU not treated with steroids during admission. E and F, VL and CDSS decline over time according to day of hospitalization and adjusted for days of symptoms and steroid use only in patients admitted to the PICU. Details of the exact numbers and P values for each time point are specified in Supplementary Table 6. Abbreviations: CDSS, Clinical Disease Severity Score; CI, confidence interval; LS, length of stay; PICU, pediatric intensive care unit; RSV, respiratory syncytial virus.

