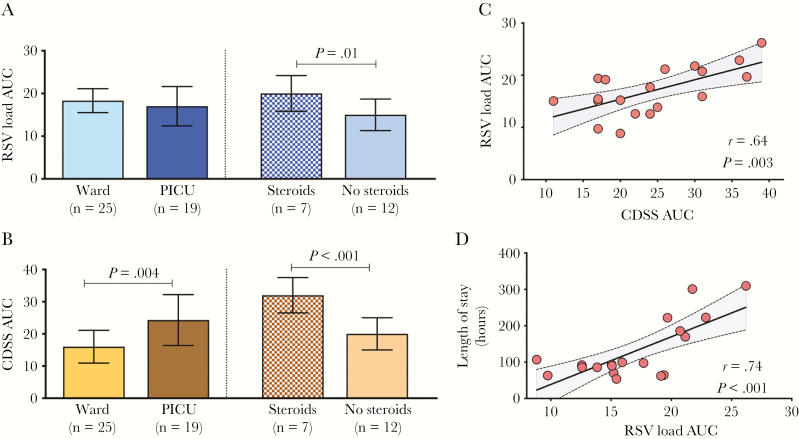
Figure 4.
Respiratory syncytial virus (RSV) load and Clinical Disease Severity Score (CDSS) area under the curve (AUC) analyses. A and B, Representation of the differences in viral load (VL) and CDSS AUC between pediatric intensive care unit (PICU) (stratified by steroid use) and ward patients with RSV lower respiratory tract infection. Raw data were used for AUC analyses, and values calculated using the midpoint rule, for patients with complete data for the first 3 days of hospitalization. Differences in AUC were assessed using 2-samples t test (P < .05), with a Satterthwaite correction for unequal group variance. C and D, Correlations between VL AUC and CDSS AUC and VL AUC with length of stay exclusively in infants admitted to PICU; r represents the Pearson correlation coefficient. Dots represent the pair information for each patient. Abbreviations: AUC, area under the curve; CDSS, Clinical Disease Severity Score; PICU, pediatric intensive care unit; RSV, respiratory syncytial virus.

