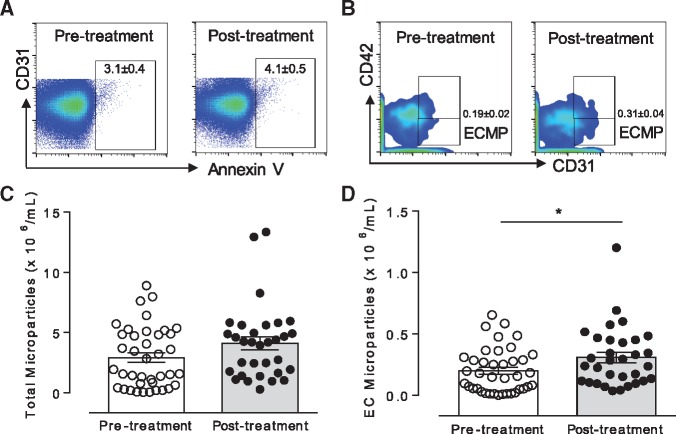
Figure 2.
VEGFi increase ECMPs. (A) Representative of MPs events identified in plasma from patients pre-treatment and post-treatment with VEGFi. (B) Representative of ECMPs events identified pre-treatment and post-treatment with VEGFi. (C, D) Scatter plot graphs representing the total number of MPs and ECMPs, respectively identified in plasma pre-treatment and post-treatment with VEGFi (n = 32–39). Results represent the mean ± SEM. Data were analysed using t-test. *P < 0.05 vs. pre-treatment.

