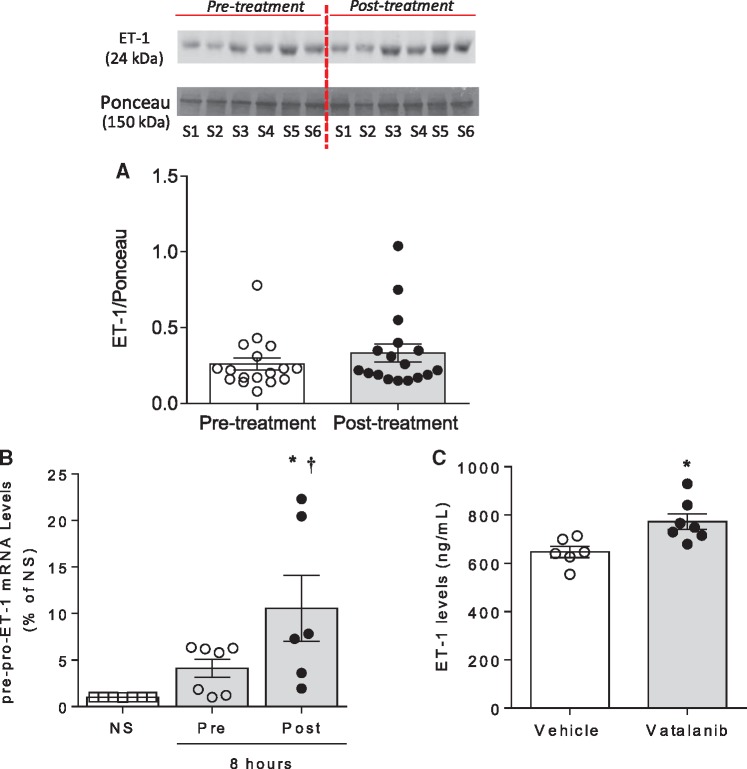
Figure 3.
Post-treatment MPs increase pre-pro-ET-1 gene expression in HAEC. (A) Graph represents the expression of ET-1 assessed by immunoblotting in plasma isolated MPs from patients pre-treatment and post-treatment with VEGFi (n = 17). The image shows six samples from one patient and is representative of the 17 patients, pre-treatment and post-treatment. (B) Pre-pro-ET-1 mRNA levels assessed by qPCR in HAEC exposed to total pre-treatment (grey bar) and post-treatment (black bar) MPs for 8 h and non-stimulated (NS, white bar) HAEC (n = 6–7). (C) ET-1 levels measured by ELISA in media from HAEC stimulated with vehicle or vatalanib (VEGFi) for 8 h (n = 6–7). Results represent the mean ± SEM. Data were analysed using t-test or one-way ANOVA followed by a post hoc Tukey test when appropriate. *P < 0.01 vs. NS, †P < 0.05 vs. pre-treatment. S, subject.

