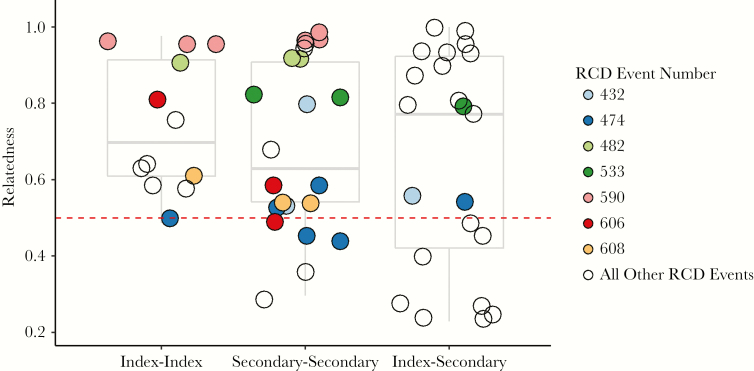
Figure 2.
There were 56 pairwise comparisons between samples from the same RCD event, representing 23 unique RCD events. Each of the 56 comparisons were binned according to whether the comparison was between 2 index cases (index–index), between 2 secondary cases (secondary–secondary), or between an index case and a secondary case (index–secondary) from the same RCD event. Genetic relatedness is shown for each of the 56 comparisons, represented as circles. For 7 RCD events that had comparisons in >1 category (index–index, secondary–secondary, or index–secondary), comparisons are shaded identically. Pairwise comparisons from RCD events for which only 1 category is represented are shown with hollow circles. The distributions of all pairwise comparisons for each of the 3 categories are shown by boxplots.

