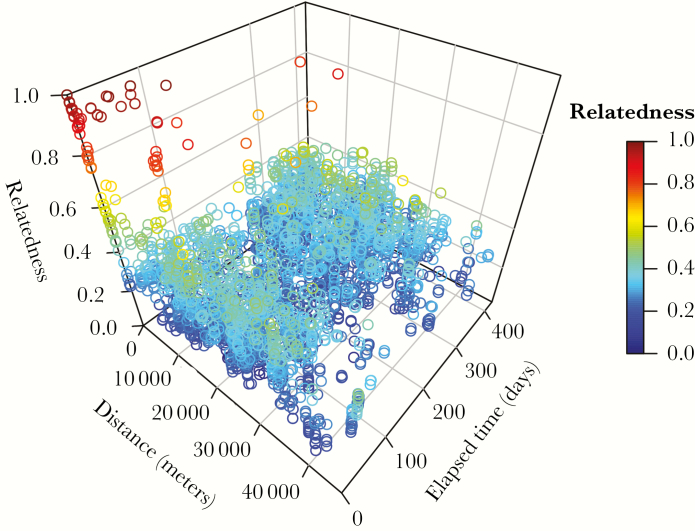
Figure 3.
Relatedness declines across space and time. Each hollow circle represents a unique pairwise comparison between 2 samples. Circles are colored and positioned along the vertical axis according to the genetic relatedness between the samples compared. Relatedness of 1.0 (red) indicates that the samples are highly related, and relatedness of 0.0 (blue) indicates that the samples are unrelated. Physical distance and elapsed time between sample pairs are shown on the two horizontal axes.

