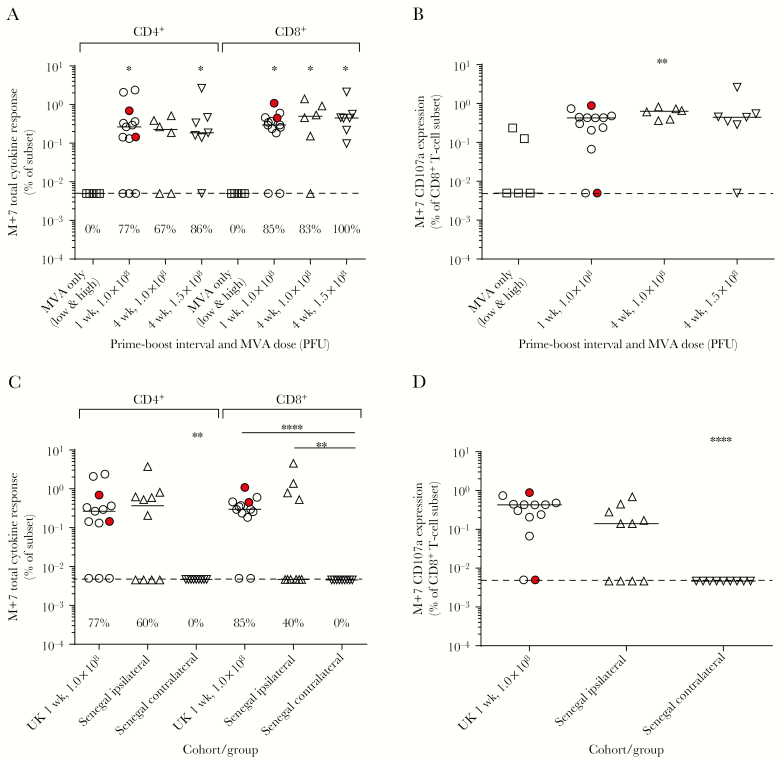
Figure 4.
Total cytokine responses. A, Total cytokine response measured by flow cytometry with intracellular cytokine staining 7 days postboost according to interval and modified vaccinia Ankara (MVA) dose in the UK cohort (Kruskal–Wallis analysis with Dunn posttest comparisons to the MVA-only group, P = .0529 and P = .0136 in the CD4+ and CD8+ subsets, respectively). Percentages above the x-axis indicate response rates in each. B, Expression of the degranulation marker CD107a in the CD8+ subset 7 days postboost in the UK group; Kruskal–Wallis test, P = .0152. C, Total Ebola glycoprotein–specific cytokine responses in Senegalese groups compared with the matched UK group. Kruskal–Wallis test with Dunn multiple comparisons, P = .0085 and P < .0001 for the CD4+ and CD8+ subsets, respectively. D, Frequency of CD107a+CD8+ T cells in Senegalese groups compared to the matched UK group; Kruskal–Wallis test, P = .0002. Horizontal bars indicate group medians and dashed lines show the lower limit of detection. UK volunteers who received vaccines in a contralateral regimen are highlighted in red. Intracellular cytokine staining (ICS) data are available for 5 of 6 MVA-only volunteers, 13 of 16 in the UK 1-week 1.0 × 10⁸ group, 6 of 8 in the UK 4-week 1.0 × 10⁸ group, 7 of 8 in the UK 4-week 1.5 × 10⁸ group, 10 of 20 in the Senegal ipsilateral group, and 9 of 20 in the Senegal contralateral group. Data are not present if there were too few fresh cells remaining after enzyme-linked immunospot assay to conduct ICS, if too few events were obtained, or the sample failed assay quality control. Asterisks indicate level of significance between groups calculated using Dunn posttest comparison after Kruskal–Wallis analysis. *P < .05, **P < .01, ****P < .0001. Abbreviations: M+7, 7 days post– modified vaccinia Ankara; MVA, modified vaccinia Ankara; PFU, plaque-forming units; UK, United Kingdom.

