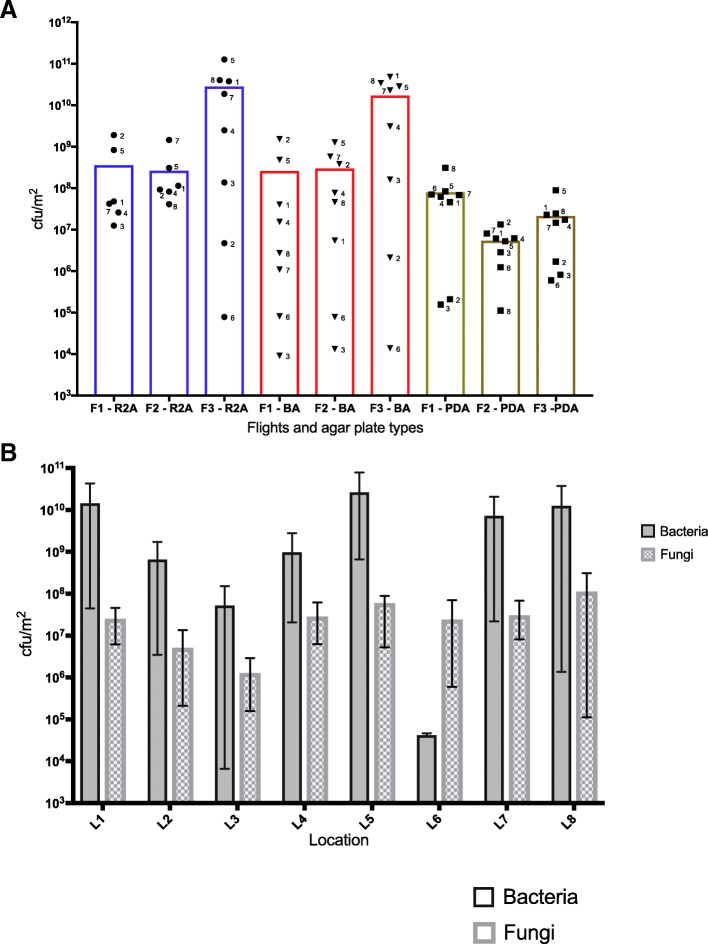
Fig. 2.
Cultivable bacterial and fungal burden from eight locations on the ISS over a 14-month period. a Scatter plot representing the CFU/m2 of bacteria and fungi at each location across three flight sampling events. Each column represents a Flight and the type of medium the samples were plated on. Each symbol in that column represents a location sampled during that Flight (N = 8). The colored boxes represent the different types of plates the samples were cultured on: Reasoner’s 2A (R2A) or blood agar (BA) plates to isolate bacteria and potato dextrose agar (PDA) plates to isolate fungi. The height of the colored box indicates the average CFU/m2 for samples in that group. F1 = flight 1 sampling session, F2 = flight 2 sampling session, and F3 = flight 3 sampling session. NB: There was no growth on R2A plates from location 6 sampled during F1 and F2 and from location 3 sampled during F2. b Bar graph representing the CFU/m2 based on location. The number of bacteria isolated on R2A and BA plates were averaged to obtain a number for “Bacteria.” The bars represent the average CFU/m2 at each location with the capped lines showing the lowest and highest value in that group (N = 3). The differences in averages observed in (a, b) were not statistically significantly different (Kruskal-Wallis test followed by Dunn’s post-hoc test P > 0.05). The average number of bacteria and fungi found at each location were similar

