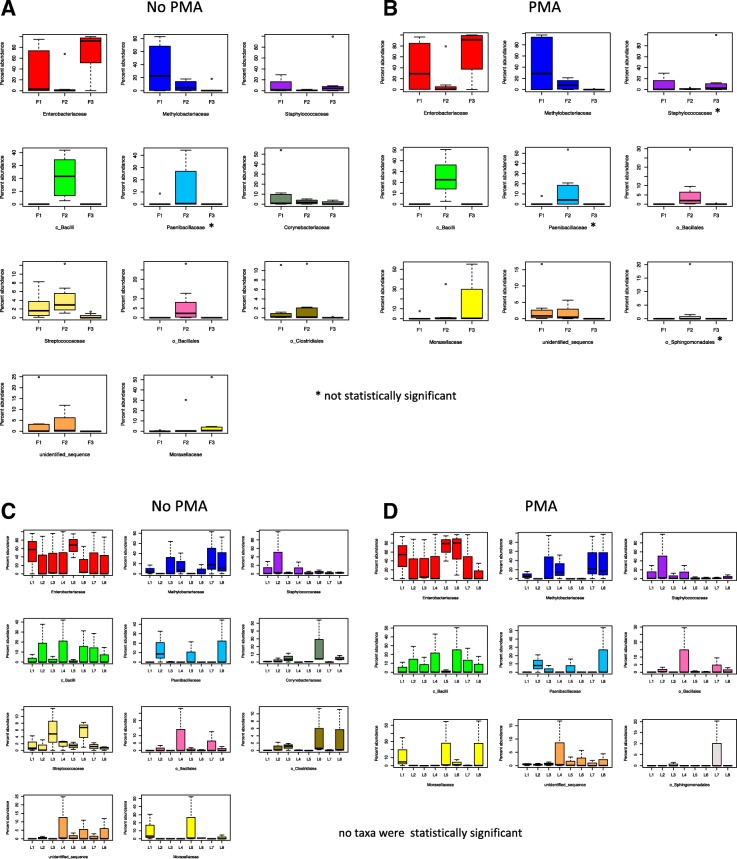
Fig. 6.
Temporal and spatial distribution of the ISS microbiome over 14 months and across eight locations. Boxplots show the temporal (a, b) and spatial (c, d) distribution of the most relatively abundant family level taxa (as presented in Fig. 4). The box in each graph signifies the 75% (upper) and 25% (lower) quartiles and thus shows the percent abundances for 50% of the samples (N = 8). The black line inside the box represents the median. The bottom whisker represents the lowest datum still within the 1.5 interquartile range (IQR) of the lower quartile, with the top whisker representing the highest datum still within the 1.5 IQR of the upper quartile. Open circles are outliers. “o” and “c” represent sequences that could not be taxonomically assigned past the order or class level respectively. “F” indicates Flight and “L” indicates Location. a Temporal distribution over time in untreated samples. All taxa showed statistically significant changes over time except Paenibacillaceae (denoted by *). b Temporal distribution in PMA-treated samples. Taxa showed statistically significant changes over time except Paenibacillacae, Staphylococcaceae, and o_Sphingomondales (denoted by *). Spatial distribution in untreated samples (c) and in PMA treated samples (d). There were no statistically significant differences in these taxa across the eight locations. Significance was measured using ALDEx2 and based on the Benjamini-Hochberg corrected P value of the Kruskal-Wallis test (significance threshold, P < 0.05). Those sequences that could not be resolved to the family level are prefixed with either “o” for Order or “c” for Class

