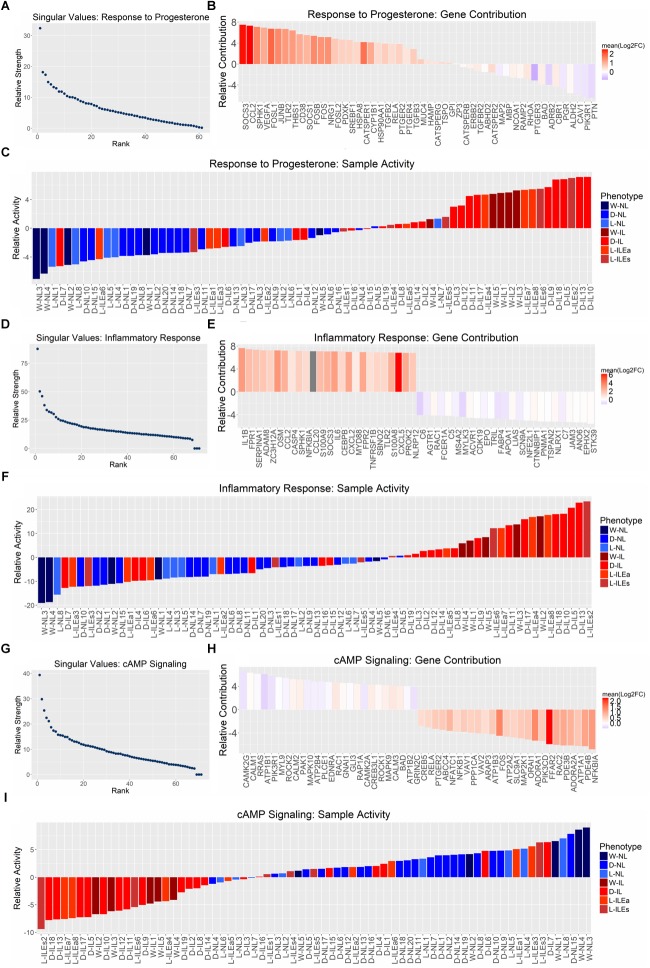
FIGURE 6.
Pathway-specific SVD analysis. SVD results for the gene sets (A) GO response to progesterone, (B) hallmark inflammatory response, and (C) KEGG cAMP signaling pathway. All studies were combined (12,622 genes × 71 tissues) and then reduced to the genes within each gene set. (A,D,G) Show the distribution of singular values, (B,E,H) show the top 25 genes associated with each phenotype based on loading value [genes are colored by their mean log2(fold change) value across all four sample group comparisons (Figure 1)], and (C,F,I) show the gene set activity (loading value) for each sample (samples are colored based on their originally reported clinical phenotype).

