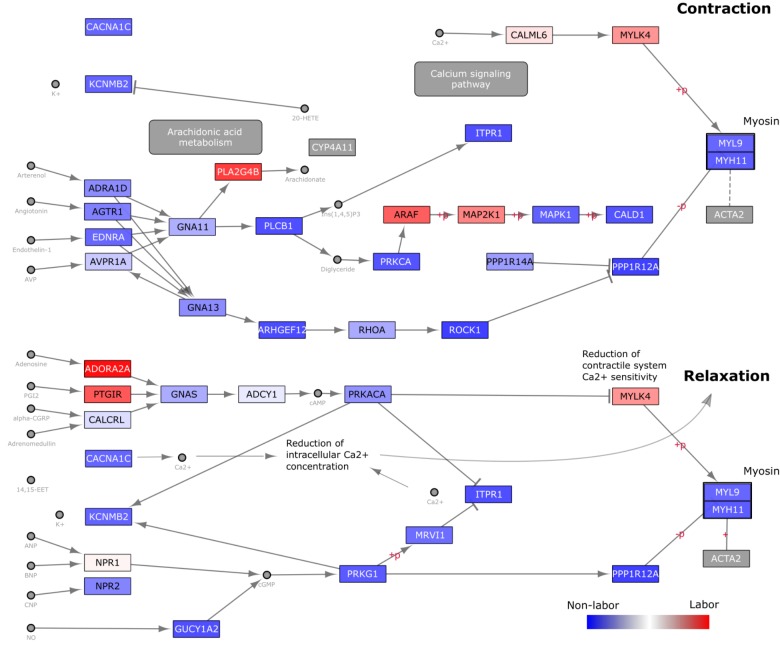
FIGURE 7.
Visualization of gene expression changes on KEGG Vascular Smooth Muscle Contraction (VSMC) Pathway Diagram. The Homo sapiens VSMC pathway diagram was downloaded in KGML format from KEGG and loaded into Cytoscape. Nodes (genes) are colored based on loading values for the dominant singular vector from performing singular value decomposition on the reduced (to include only genes within the VSMC pathway) Warwick expression matrix. These values were directly loaded into Cytoscape as a node table and used in a continuous manner in the style tab for node coloring. Blue nodes indicate genes with higher expression in the W-NL group, red higher expression in the W-IL group, and white no differential expression.

