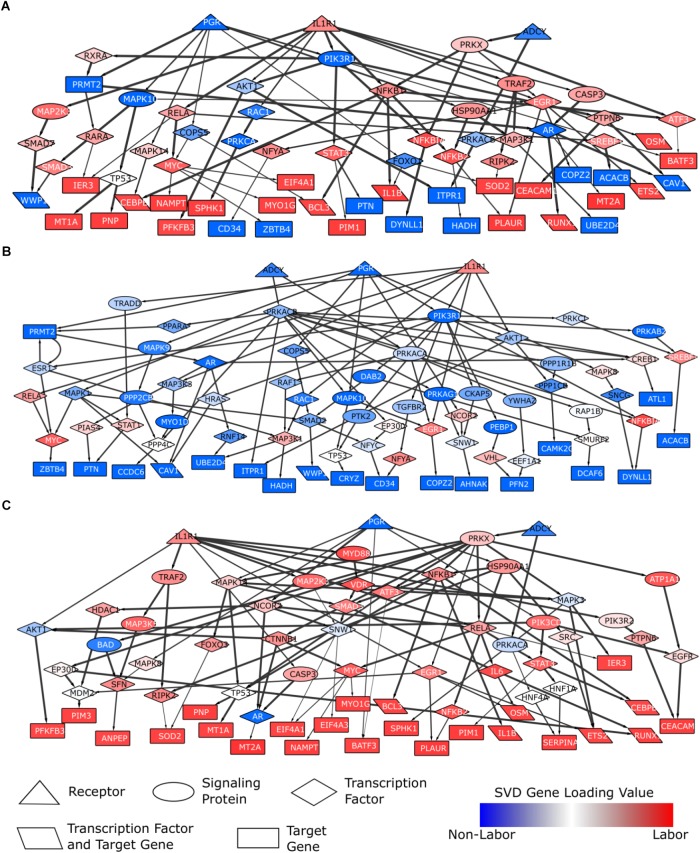
FIGURE 8.
Parturition-specific signaling networks constructed using shortest paths and differential expression data. Shortest paths were calculated on a curated, directed, weighted signaling network. Shortest paths were obtained from each of the three pathway initiator proteins (PGR, IL1R1, ADCY; chosen to represent progesterone, inflammatory, and cAMP signaling) to each downstream target gene. Nodes in the network were weighted based on gene loadings from the dominant singular vector when performing SVD on the combined expression matrix (3 studies; 12622 genes × 71 samples). (A) A general parturition signaling network. Target genes consisted of the top 50 genes associated with the non-laboring and laboring sample groups (100 total input genes). Nodes were weighted such that those with strong phenotype associations had the lowest cost. Paths falling in the top 50%, in terms of lowest costs, were retained. (B) A parturition signaling network prior to labor (i.e., quiescence). Target genes consisted of the top 50 genes associated with the non-laboring sample groups. Nodes were weighted such that genes highly expressed in the non-laboring samples had low costs, those with roughly equal expression across the two phenotypes had a medium cost, and genes with higher expression in the laboring samples had high cost. (C) A parturition signaling network during labor. Target genes consisted of the top 50 genes associated with the non-laboring sample groups. Nodes were weighted opposite of the quiescent network in (B). All paths were retained for the networks in (B,C). Networks were visualized in Cytoscape. Node shapes are based on function/pathway location, node colors correspond to their respective weights, and edge width is proportional to the weights in the original network (thicker meaning higher confidence).

