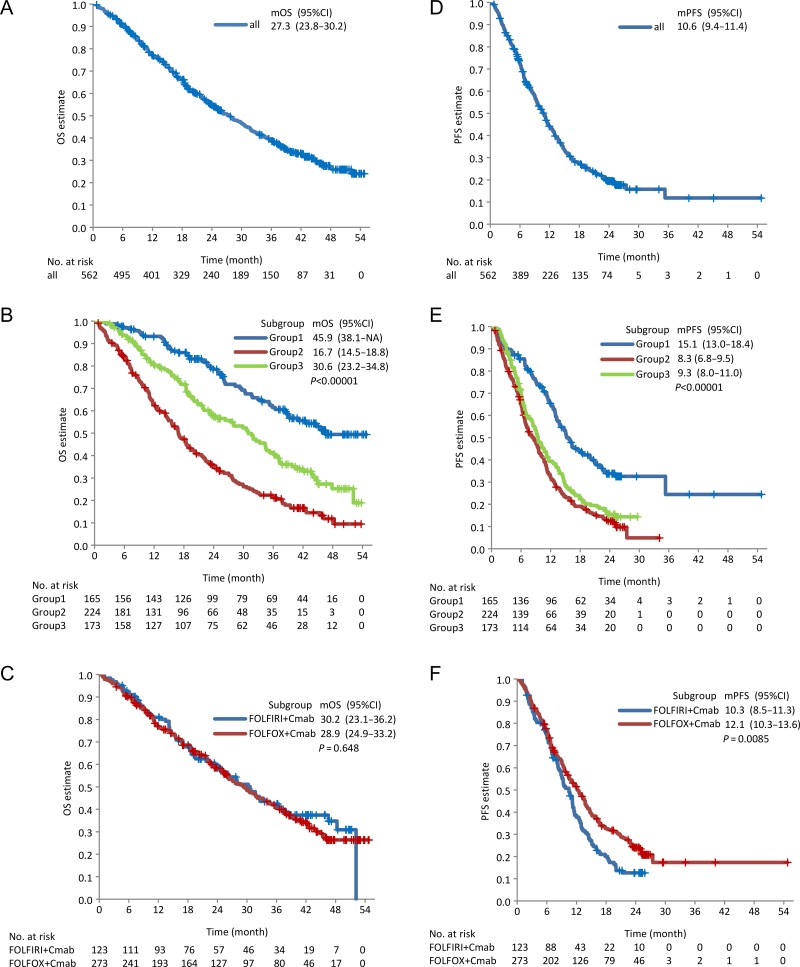
Figure 1.
Kaplan–Meier estimates for OS and PFS. OS and PFS in all patients (A and D) in Groups 1, 2 and 3 (B and E) and those in patients treated with FOLFOX + cetuximab and FOLFIRI + cetuximab (C and F, respectively). Two-sided P values were evaluated by the log-rank test. The median OS or PFS is shown in each figure with 95% CI. mOS, median OS; mPFS, median PFS; OS, overall survival; PFS, progression-free survival; CI, confidence interval.

