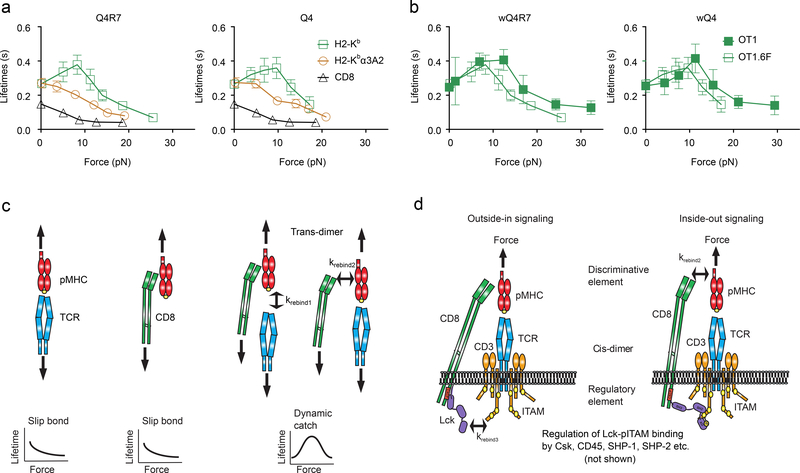
Figure 7 |. Outside-in/Inside-out Loop of the TCR Mechanotransduction apparatus.
a, Mean ± s.e.m. of lifetime vs. force plots of OT1.6F TCR bonds with mQ4R7 and mQ4 (brown circle), CD8 bond with wVSV (black triangle), and total TCR and/or CD8 bonds with wQ4R7 and wQ4 (green square). The numbers of lifetime measurements per curve, the results of statistical tests examining the trends of the curves and their differences are summarized in Supplementary Table 1c, 2d and 3b, respectively. b, Mean ± s.e.m. of lifetime vs. force plots of total bonds of OT1 (green square, reports from Figs. 1b and 4a) and OT1.6F (black square) thymocytes with wQ4R7 and wQ4. The results of statistical tests examining their differences are summarized in Supplementary Table 3c. c, d, Model of the outside-in/inside-out loop of the TCR mechanotransduction apparatus. The loop consists of two orthogonal heterodimeric interactions: An extracellular trans-interaction of TCR and CD8 with pMHC to form a cooperative trimolecular catch bond, despite that in the absence of synergy, the two TCR–pMHC and CD8–pMHC bimolecular interactions only form slip bond (c). This is coupled to an intracellular cis-interaction of CD8-associated Lck with TCR/CD3 ITAMs, which allows signaling differentially triggered from outside-in by the discriminative element (TCR recognition) to modulated by the regulatory element (Lck and related molecules), resulting in inside-out signaling (d).

