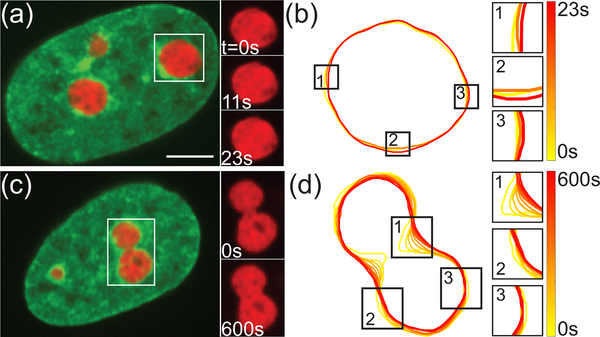
FIG. 1.
Nucleolar dynamics in live human cells. (a) Micrograph of HeLa cell nucleus with fluorescently labeled chromatin (green, H2B-GFP) and nucleoli (red, NPM-mApple). Inset shows an enlarged view of boxed nucleolus at t = 0, 11, 23 s. (b) Contours of nucleolus from (a) at t = 0, 11, 23 s. Insets 1–3 show a zoomed in view of nucleolar surface fluctuations. (c) Micrograph of HeLa cell nucleus with fluorescently labeled chromatin (green, H2B-GFP) and two fusing nucleoli (red, NPM-mApple). Inset shows an enlarged view of boxed fusion event at t = 0 and 600 s. (d) Contours of nucleolus from (c) in 60 s intervals. Insets 1–3 show a zoomed in view of local shape changes of fusing nucleoli. Scale bar, 5 μm.

