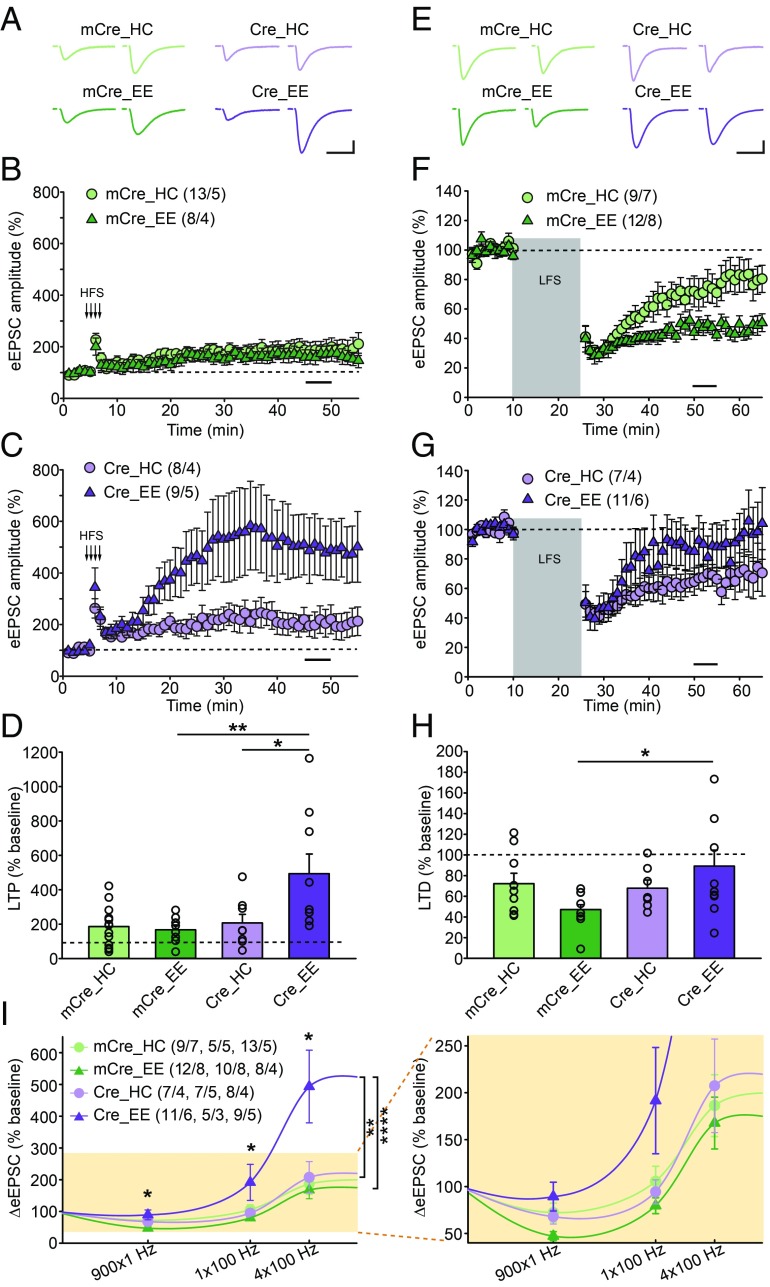
Fig. 1.
Enhanced LTP and reduced LTD in CA1-RARα KO mice with EE experience. (A–D) Quantification of SC-CA1 LTP in WT (mCre) and CA1-RARα KO (Cre) mice exposed to home cage (HC) or EE experience. (A) Representative traces of SC-CA1 evoked EPSCs (eEPSC) before and after LTP induction. (Scale bars: 50 pA, 25 ms.) (B and C) Summary graphs of CA1 LTP in WT or RARα KO neurons with HC or EE exposure. (D) LTP magnitude is measured as average potentiation at 41–45 min (black bar in B and C) after onset of high-frequency train stimulation (HFS) induction (indicated by arrows in B and C) [comparisons by two-way ANOVA: HC/EE × mCre/Cre: F(1,34) = 5.571, P = 0.0241; Tukey post hoc test: *P < 0.05, **P < 0.01]. (E–H) Quantification of SC-CA1 LTD in WT and CA1-RARα KO mice exposed to HC or EE conditions. (E) Representative traces of SC-CA1 eEPSCs. (Scale bars: 50 pA, 25 ms.) (F and G) Summary graphs of CA1 LTD. (H) LTD magnitude is measured as average depression at 40–45 min (black bar in F and G) after onset of low-frequency stimulation (LFS) induction (gray bar in F and G) [comparisons by two-way ANOVA: HC/EE × mCre/Cre: F(1,35) = 4.508, P = 0.0409; Tukey post hoc test: *P < 0.05]. (I) Stimulus strength and CA1 eEPSC response functions derived from HC- and EE-exposed WT and CA1-RARα KO mice. Data points for 900 × 1 Hz represent the average change 40–45 min after the onset of 900 pulses of a 1-Hz stimulus train. Data points for 1 × 100 Hz and 4 × 100 Hz represent the average change 40–45 min after the onset of high-frequency stimulus trains. The asterisk on top of each stimulus pattern indicates significant HC/EE × mCre/Cre interaction (P < 0.05) for that stimulus pattern by two-way ANOVA. For 1 × 100 Hz, comparisons were made by two-way ANOVA [HC/EE × mCre/Cre: F(1,23) = 6.574, P = 0.0173; Tukey post hoc test: *P < 0.05]. For the entire BCM curve, comparisons were made by two-way ANOVA [stimulation pattern × (genotype + experience): F(6,92) = 3.271, P = 0.0058; Tukey post hoc test: mCre_HC vs. mCre_EE, not significant; Cre_HC vs. Cre_EE, **P < 0.01; mCre_EE vs. Cre_EE, ****P < 0.0001]. n/N, number of neurons/number of independent experiments. All graphs represent mean ± SEM.

