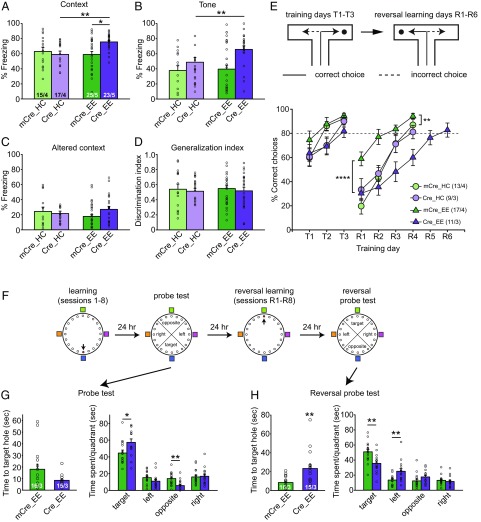
Fig. 3.
Enhanced hippocampus-dependent memory but reduced learning flexibility in CA1-RARα KO mice with EE experience. (A–D) Behavioral quantification of contextual and cued fear conditioning. Contextual fear memory (A) and cued fear memory (B) were measured 24 h and 48 h after training, respectively (two-tailed Mann–Whitney U test with Bonferroni correction: *P < 0.05, **P < 0.01). (C) Fear memory generalization in an altered context was measured 48 h after training. (D) Discrimination index = [Fz (Training Context) − Fz (Altered Context)]/[Fz (Training Context) + Fz (Altered Context)]. Fz, percent freezing. (E) Performance of WT and CA1-RARα KO mice in the water T-maze. After reaching the 80% learning criteria (T1–T3), the platform was moved to the opposite arm to start reversal training (R1–R6) the next day. Training was terminated after 4 d of reversal training, with the exception of the case of the Cre_EE group, where 2 additional days of training were necessary for the animals to reach learning criteria [statistical analysis was performed using two-way repeated-measures ANOVA: T1–T3: group factor, F(3,46) = 2.012, P = 0.1253; time factor, F(2,92) = 30.67, P < 0.0001; interaction, F(6,92) = 1.389, P = 0.2276; R1–R4: group factor, F(3,46) = 9.66, P < 0.0001; time factor, F(3,138) = 72.78, P < 0.0001; interaction, F(9,138) = 3.44, P = 0.0008; Tukey post hoc test: mCre_EE vs. mCre_HC, **P < 0.01; mCre_EE vs. Cre_EE, ****P < 0.0001]. (F) Schematics of training and testing paradigm for the Barnes maze. (G) Performance of WT and CA1-RARα KO mice during the first probe test, measured as time to the target hole and time spent in each quadrant (two-tailed Mann–Whitney U test: *P < 0.05, **P < 0.01). (H) Performance of WT and CA1-RARα KO mice during the second probe test after reversal learning, measured as time to the target hole and time spent in each quadrant (two-tailed Mann–Whitney U test: **P < 0.01). n/N, number of mice/number of independent litters. All graphs represent mean ± SEM.

