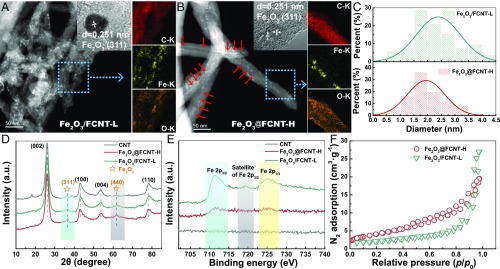
Fig. 2.
Structure of the catalysts. (A and B) Representative HADDF-STEM images of Fe2O3/FCNT-L and Fe2O3@FCNT-H (Insets) HRTEM images of the Fe2O3 nanoparticles; dexter figures show the EDX elemental mappings of the selected area. (C) Size-distribution histograms of the Fe2O3 nanoparticles in both samples. (D) XRD patterns and (E) Fe 2p XPS spectra of CNT, Fe2O3/FCNT-L and Fe2O3@FCNT-H. (F) N2 adsorption–desorption isotherms of Fe2O3/FCNT-L and Fe2O3@FCNT-H.

