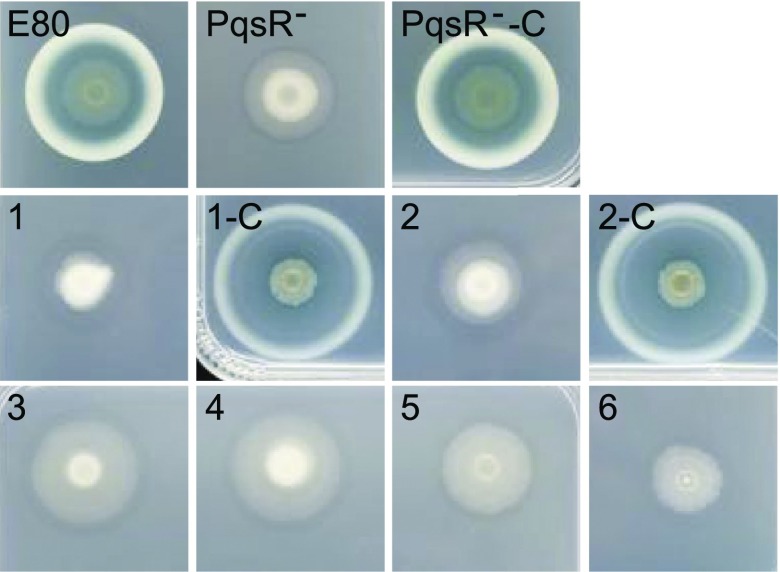
Fig. 3.
The relationship between PQS and protease production in strain E80. The top row shows an E80 colony, an E80 PqsR mutant, and the PqsR mutant complemented with a functional pqsR (PqsR−-C) in the att site. The middle and bottom rows show colonies of E80 freeloaders (1–6) and colonies of freeloaders 1 and 2 complemented with pqsR in the chromosomal att site (1-C and 2-C).

