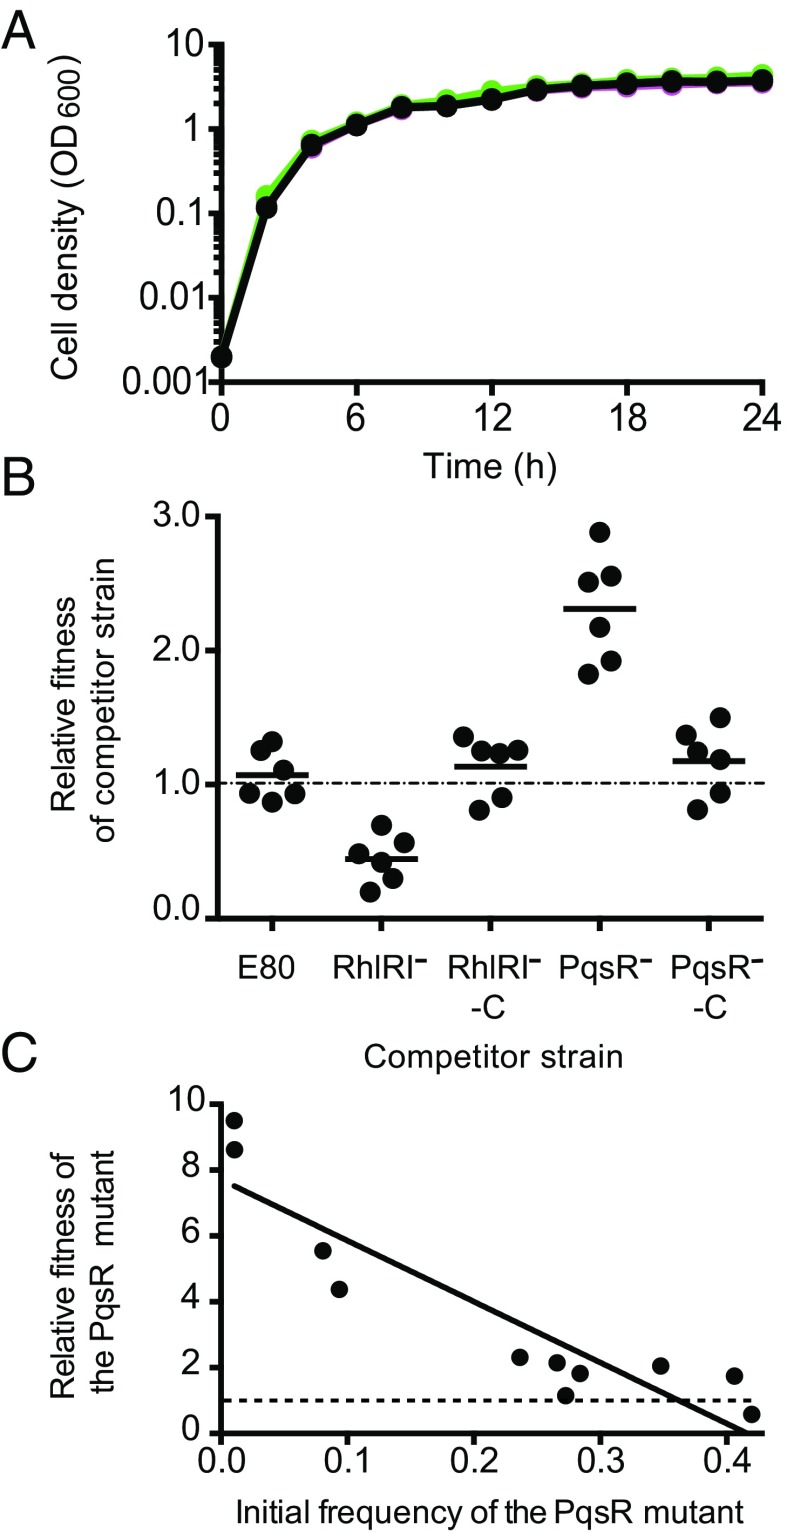
Fig. 5.
Growth and competition of the PqsR mutant, the RhlRI mutant, and the parent strain E80. (A) Growth of E80 (black), the RhlRI− mutant (magenta), and the PqsR− mutant (green) in LB-Mops broth. Cell density was measured as OD600, and data are the means of three biological replicates ± SD. (B) Competition experiments showing the competitive indexes of competitor strains against the parent strain (E80 or E80-Gm) after 24 h in LB-Mops broth. Each symbol represents the outcome of an individual experiment; the solid lines represent means for each group. The starting percentage of the competitors was 10%. The RhlRI mutant was less fit than the parent, and the PqsR− mutant was more fit than the parent. (C) The relative fitness of a PqsR mutant exhibits a negative frequency dependence. Data are from 24-h casein broth cultures. The outcomes above the dashed line indicate the competitor had a fitness advantage and below indicate the parent E80 had a fitness advantage.

