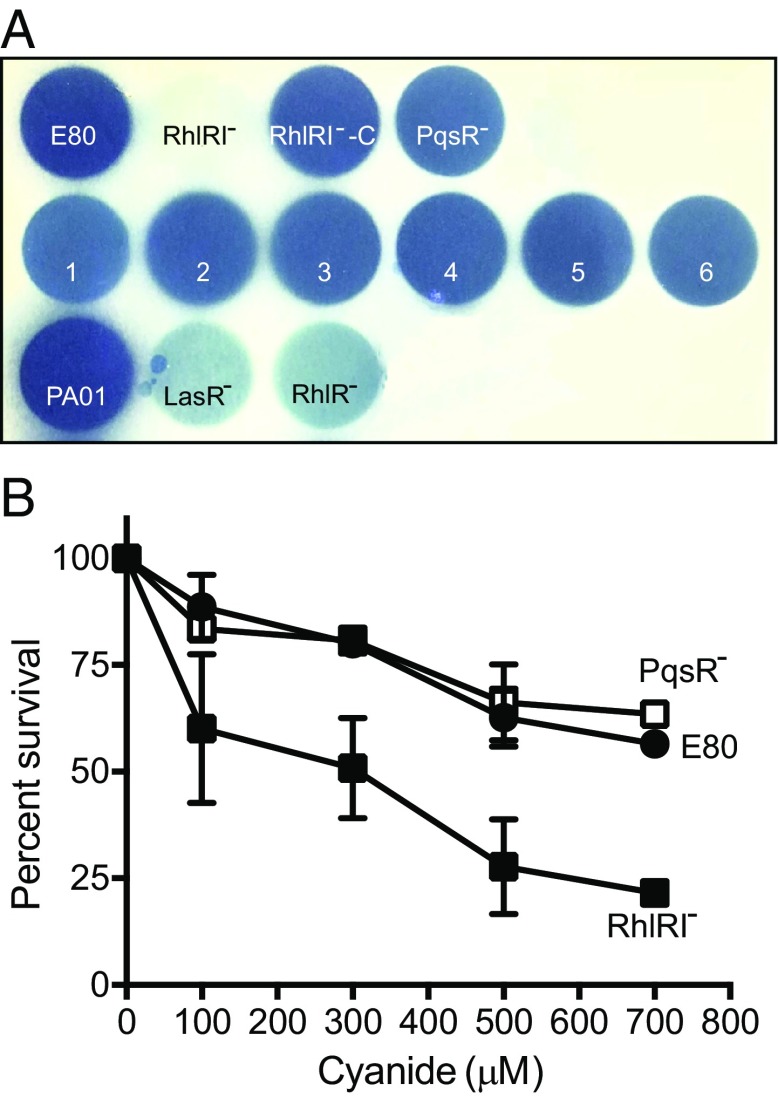
Fig. 6.
Cyanide production by and sensitivity of a variety of P. aeruginosa strains and mutants. (A) Cyanide was monitored as described in Materials and Methods. The blue coloration of the filter paper reflects cyanide production. The top row is the parent strain E80 and various E80 mutants. The middle row is protease-deficient mutants 1–6, and the bottom row is strain PAO1, a PAO1 LasR mutant, and a PAO1 RhlR mutant shown for comparison. (B) Cyanide-killing curves for E80, the PqsR mutant, and the RhlRI mutant. Results are normalized to the number of cfu without cyanide. Data are the means of three replicates ± SD.

