Fig. 2.
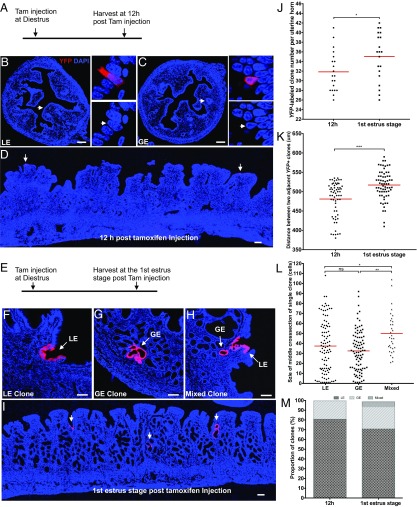
Fate of single endometrial epithelial cell during uterine regeneration. (A) Experimental design for single epithelial cell marking. A single low dosage of tamoxifen (0.01 mg/g mouse body weight) was given to adult Keratin19CreERT2;Rosa26YFP/+ mice (n = 20) at diestrus, then uteri were collected at 12 h posttamoxifen injection for analysis. (B) Single luminal epithelial cell (LE) and (C) single glandular epithelial cell (GE) were marked by yellow fluorescent protein (YFP, red color) at 12 h posttamoxifen injection. (Insets) Higher magnification of single epithelial cells marked by YFP. (D) Widely distributed YFP-labeled single epithelial cells. (E) Experimental design for single epithelial cell tracing over one estrous cycle. A low dosage of tamoxifen (0.01 mg/g body weight) was given to adult Keratin19CreERT2;Rosa26YFP/+ mice (n = 20) at diestrus, then uteri were collected at the first estrus stage posttamoxifen injection for analysis. (F) A representative luminal epithelial clone (LE clone). (G) A representative glandular epithelial clone (GE clone). (H) A representative mixed clone (MC) containing both luminal and glandular epithelia. (I) The YFP-labeled epithelial clones, indicated by arrows, are widely separated at the first estrus stage posttamoxifen injection. (J) Number of YFP-labeled clones at 12 h or first estrus stage posttamoxifen injection, which is shown as clone number per uterine horn. Each point represents an average from two uterine horns of a single mouse (n = 20). Unpaired t test was applied here for the data assessment. (K) Distance between two adjacent YFP+ clones at 12 h or first estrus stage posttamoxifen injection. Mann–Whitney U test was applied here for the data assessment. (L) Size distribution of three types of epithelial clones at first estrus stage posttamoxifen injection, which is shown by the number of YFP+ cells in the middle cross-section of a single clone. Kruskal–Wallis test followed by Dunn’s test was applied here for the data assessment. (M) Proportion of three types of clones at 12 h or first estrus stage posttamoxifen injection. *P < 0.05; **P < 0.01; ***P < 0.001; P > 0.05, not significant (ns). (Scale bar, 100 μm in all images.)

