Fig. 3.
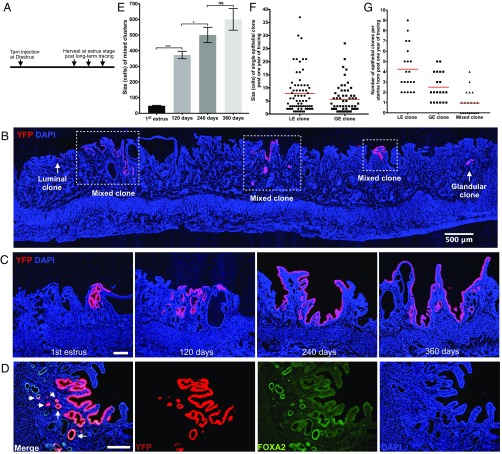
Mixed clones persist over uterine tissue turnovers. (A) Experimental design for long-term tracing of single epithelial cells. A low dosage of tamoxifen (0.01 mg/g body weight) was given to adult Keratin19CreERT2;Rosa26YFP/+ mice (n = 30) at diestrus, then 10 each of these uteri were collected in estrus stage at day 120, day 240, and day 360 posttamoxifen injection for analysis. (B) A representative Keratin19:CreERT2;RosaYFP/+ mice uterine horn post 1 y of tracing. Mixed clones marked by squares. Luminal or glandular clones are shown by arrows. (C) Representative fluorescent images of single mixed clones at estrus stages post one cycle, 120 d, 240 d, and 360 d of tracing. (D) Representative fluorescent image of a single mixed clone stained with lineage marker YFP (red) and glandular-specific marker FOXA2 antibody (green). Arrows in merged panel (Left) indicate FOXA2+ glandular cells. (E) Size of single mixed clones over a lifetime of tracing, shown by number of YFP+ cells in the middle cross-section of each single clone. One-way ANOVA followed by Tukey’s test was applied here for the data assessment. *P < 0.05; ***P < 0.001; P > 0.05, not significant (ns). (F) Size of single luminal or glandular clones after 1 y of tracing, shown by number of YFP+ cells in the middle cross-section of each single clone. (G) The number of three types of epithelial clones in one uterine horn after 1 y of tracing. (Scale bar, 500 μm in B and 100 μm in all other images.)

