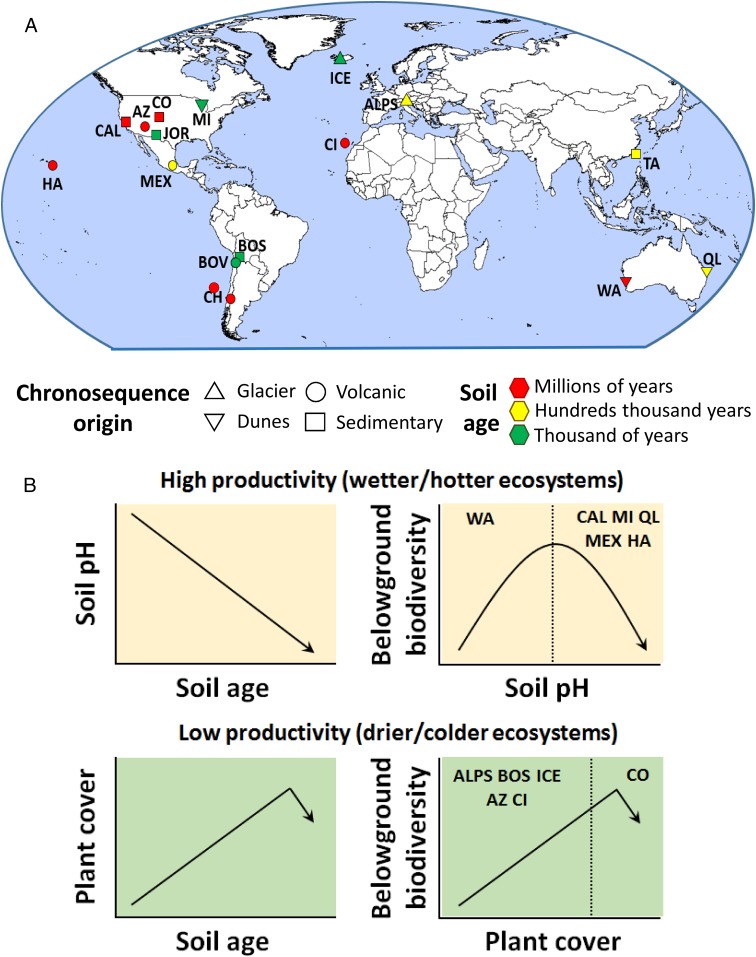
Fig. 1.
Geographical distribution and major patterns showing the fate of belowground biodiversity during pedogenesis. Belowground biodiversity is defined as the standardized average of the diversity of soil bacteria, fungi, protists, and invertebrates. (A) Locations of the 16 soil chronosequences (87 plots) included in this study. (B) A conceptual figure summarizing the major ecological patterns observed (data provided in Figs. 2 and 3). Acronyms for each chronosequence are listed in SI Appendix, Table S2. Correlations between pH and plant cover with belowground diversity across sites are shown in SI Appendix, Fig. S26.

