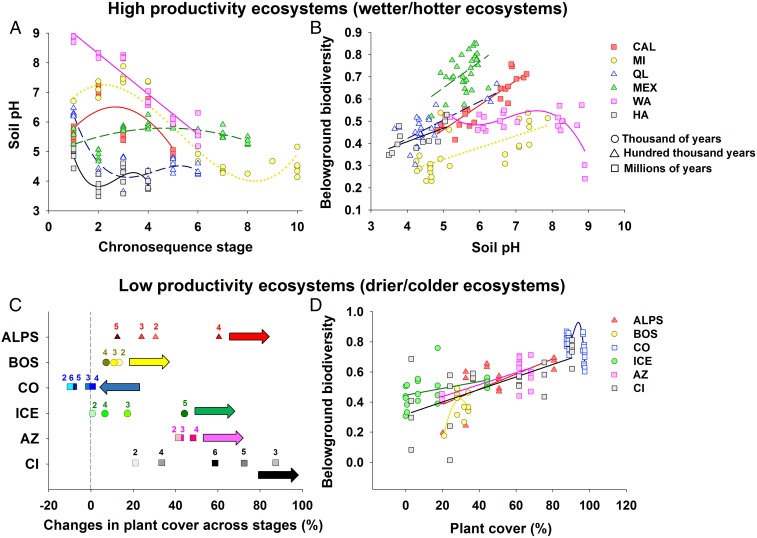
Fig. 3.
Major ecological drivers of the fate of belowground biodiversity during pedogenesis. (A and B) High-productivity ecosystems. (C and D) Low-productivity ecosystems. Statistical support for these patterns is provided in SI Appendix, Tables S10 and S11. In C, the numbers indicate the chronosequence stage, and the arrows indicate the overall directions for the changes in plant cover across stages. Changes in plant cover across chronosequence stages are calculated from stage 1 in each chronosequence.

