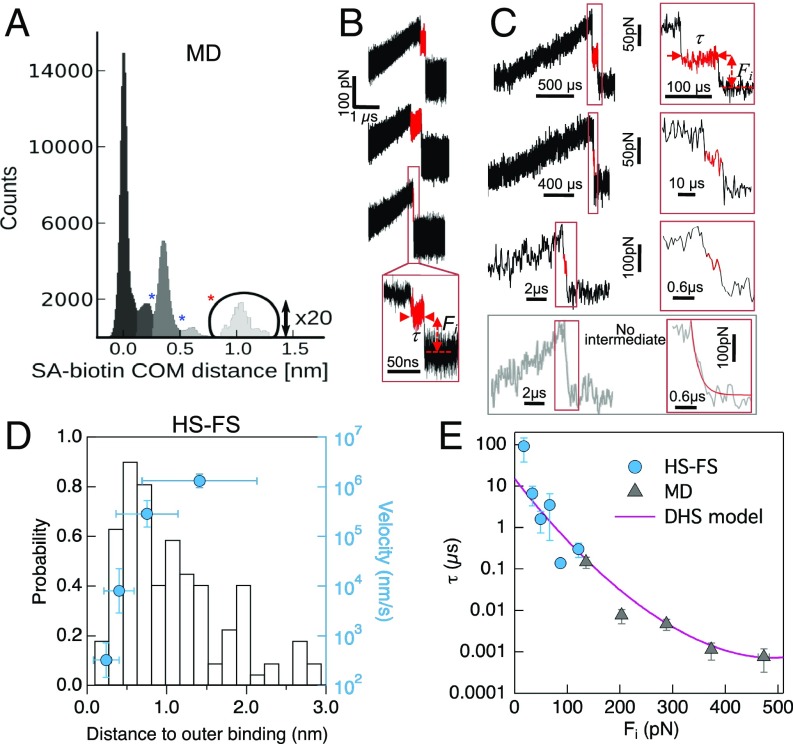
Fig. 3.
Outer barrier. (A) Distribution of COM distances between SA and b for all MD trajectories during unbinding. The first two minima coincide with the barrier positions obtained from the Brownian dynamics simulations fit of the force spectrum in Fig. 2, Inset. (B) Examples of MD and (C, top three) HS-FS force–time curves showing outer binding. The lifetime and applied force of outer binding events was determined as shown (red lines) and described in Materials and Methods. The bottom curve shows an example for which no intermediate was observed. The red line shows an exponential fit with decay time ∼0.28 µs. (D) Distribution of experimental distance to outer binding (left axis) and pulling velocity dependence of the average distance (blue, right axis). (E) Outer binding lifetime vs. applied force from HS-FS (circles) and MD simulations (triangles). The solid line shows the best fit to the force-dependent lifetime DHS model (14) with parameters τ0 = 16 ± 7 µs, xβ = 0.16 ± 0.10 nm, and ΔG = 12 ± 6 kBT. This distance the outer barrier (xβ) should be added to the position of the second barrier at xβ2 = 0.60 nm in Fig. 2 (sketched as a dashed red line in the inset).

