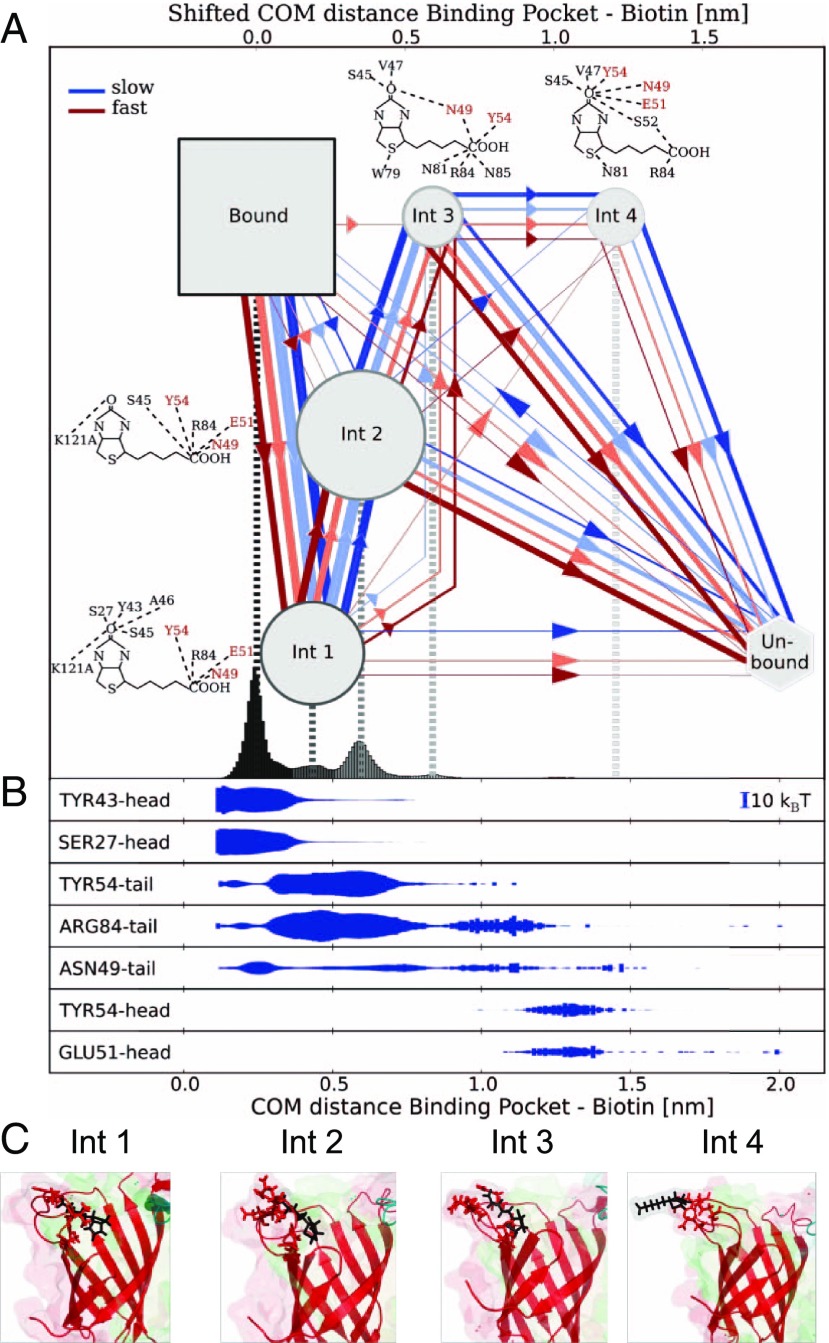
Fig. 4.
Dynamic multiplicity of SA–b unbinding pathways. (A) Bound and intermediate states with unbinding pathways observed during forced dissociation in MD trajectories. The line color reflects pulling velocity from slow (blue) to fast (red) and thickness reflects passage frequency. b molecular representations show overlays of the hydrogen bonds with SA residues for the four intermediate states. The amino acids with the strongest intermediate interactions are labeled in red. (B) The energy of the H-bonds between b and the most important residues is shown below as a function of the COM distance. (C) Structural snapshots of the different intermediate states showing H-bonds between SA residues and b.

