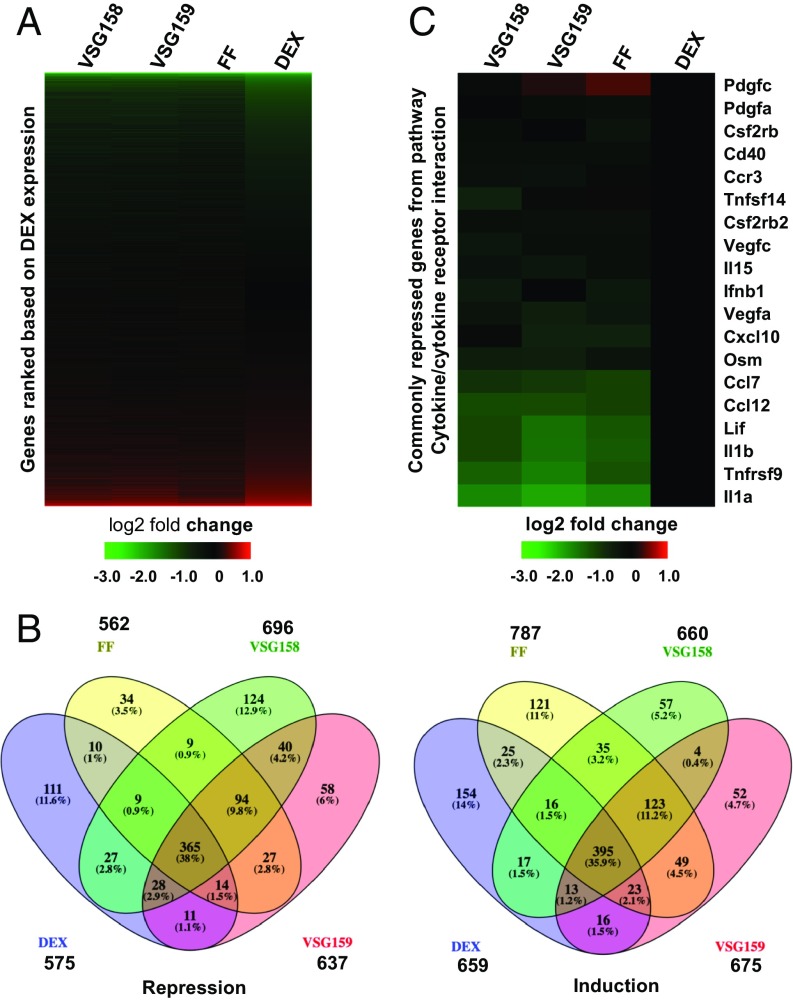
Fig. 3.
Microarray analysis of gene expression changes in response to GCs. (A) Gene profiling of the effects of VSG158, VSG159, FF, and DEX in inflammation-induced (LPS treatment) mouse macrophage RAW264 cells. Data were plotted as expression levels relative to vehicle (DMSO) and aligned to the gene expression pattern seen upon DEX treatment from most down-regulated to most up-regulated genes. (B) Venn diagrams of genes induced or repressed more than twofold in RAW264.7 cells. (C) Gene expression profile of commonly repressed genes from the cytokine–cytokine receptor interaction pathway in RAW264.7 cells. Data were normalized to DEX.

