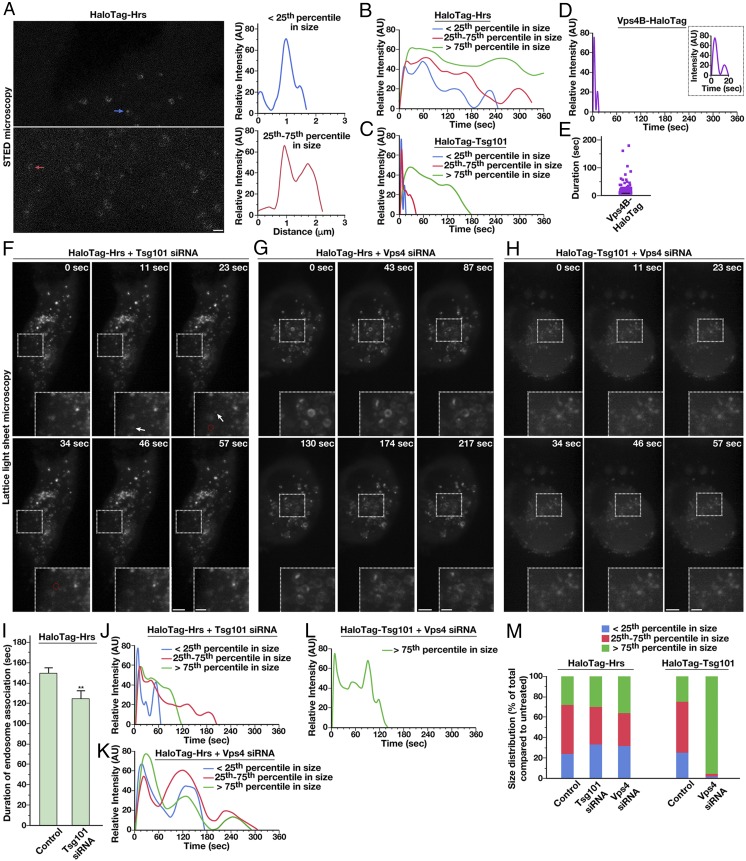
Fig. 3.
ESCRT subunit dynamics are regulated by the action of downstream ESCRT complexes. (A, Left) Representative HaloTag-Hrs–expressing cells imaged live using STED microscopy following dye labeling using the SiR-HaloTag ligand (more than 10 cells imaged, more than three biological replicates). Arrows highlight endosomes of two different size classes (blue, less than 25th percentile; red, 25th–75th percentile). (Scale bar: 1 μm.) (A, Right) Fluorescence intensity based on line-scan analysis around the circumference of each is shown, reflecting the distribution of Hrs. (B–D) Averaged fluorescence intensity profiles of labeled endosomes classified by compartment size (more than 95% of Vps4B-HaloTag–labeled compartments were diffraction-limited). Only compartments that acquire and lose fluorescence during the imaging series were used (more than 350 endosomes per condition in more than 10 cells each, more than three biological replicates). (E) Individual residency times of Vps4B-HaloTag at endosomes are plotted (more than 140 endosomes, at least 10 different cells in more than three biological replicates). A black line indicates the average. (F–H) Representative CRISPR/Cas9-modified cells imaged live using LLSM following dye labeling with the JF646-HaloTag ligand and treatment with siRNA targeting either Tsg101 or both Vps4 isoforms (more than 10 cells each, more than three biological replicates each). Projected z-stacks are shown for each time point. Arrows highlight the appearance of ESCRT-positive endosomes, and red circles denote their disappearance. (Scale bars: 5 μm; Insets, 2 μm.) (I) Quantification of the average duration of HaloTag-Hrs on endosomes in control and Tsg101-depleted cells. Error bars represent mean ± SEM (more than 400 endosomes analyzed for each cell line, more than 10 cells imaged per condition in more than three biological replicates). **P < 0.01, as calculated using a Student’s t test. (J–L) Averaged fluorescence intensity profiles of labeled endosomes classified by compartment size under the conditions shown (relative to sizes determined under normal conditions). Only compartments that acquire and lose fluorescence during the imaging series were used (more than 400 endosomes per condition, more than 10 cells imaged per condition in more than three biological replicates). (M) Size distributions of ESCRT-positive endosomes under the conditions indicated (more 400 endosomes per condition, more than 10 different cells each in more than three biological replicates).

