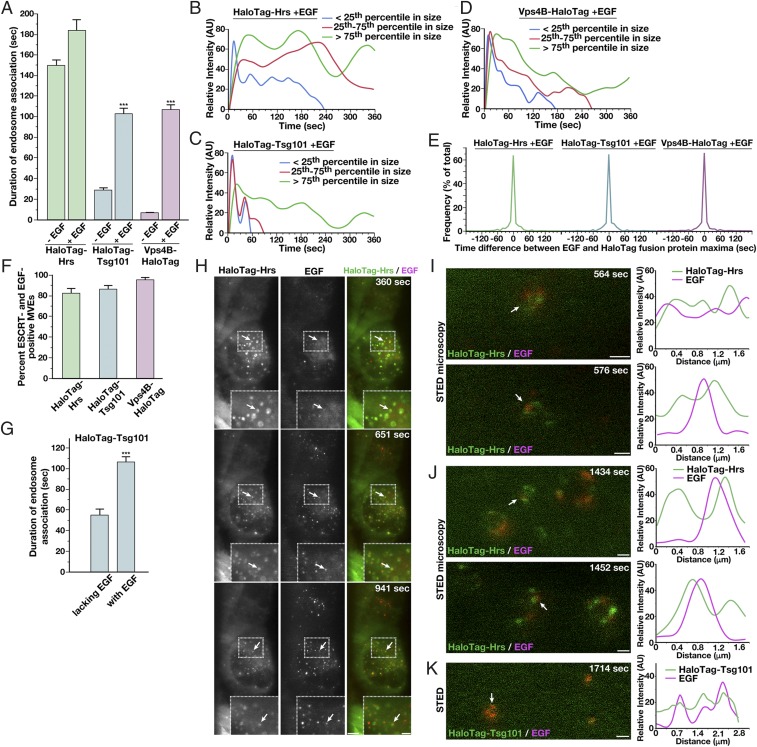
Fig. 4.
Growth factor stimulation alters ESCRT dynamics at endosomes. (A) Quantification of the average duration of each HaloTag-ESCRT fusion protein on endosomes in the presence or absence of EGF stimulation. Error bars represent mean ± SEM (more than 600 endosomes analyzed for each cell line, more than 10 cells each in more than three biological replicates). ***P < 0.005, as calculated using an ANOVA test. (B–D) Averaged fluorescence intensity profiles of labeled endosomes classified by compartment size following treatment with 30 ng/mL EGF. Only compartments that acquire and lose fluorescence during the imaging series were used (more than 350 endosomes per condition, more than 10 cells each in more than three biological replicates). (E) Time differences between Alexa Fluor 555-EGF and JF646-labeled HaloTag-ESCRT achieving maximum fluorescence intensity at endosomes are plotted (more than 400 endosomes analyzed for each cell line, more than 10 cells each in more than three biological replicates). (F) Percentages of ESCRT-labeled endosomes that exhibited EGF accumulation at any point during time-lapse imaging were calculated for each Halo-Tag ESCRT fusion. Error bars represent mean ± SEM (endosomes from more than 10 cells each in more than three biological replicates). (G) Quantification of the average duration of HaloTag-Tsg101 on endosomes, either EGF-positive or EGF-negative, following EGF stimulation. Error bars represent mean ± SEM (more than 500 endosomes analyzed, more than 10 cells each in more than three biological replicates). ***P < 0.005, as calculated using a t test. (H) Representative HaloTag-Hrs–expressing cells imaged live using LLSM following dye labeling using the JF646-HaloTag ligand and incubation with Alexa Fluor 555-EGF for 2 min, followed by washout (more 10 cells each, more than three biological replicates each). Projected z-stacks are shown for each time point. Arrows highlight HaloTag-Hrs–positive endosomes that also show accumulation of EGF. (Scale bar, 5 μm; Insets, 2 μm.) Representative HaloTag-Hrs–expressing cells (I and J) or HaloTag-Tsg101–expressing cells (K) imaged live using STED microscopy following dye labeling using the SiR-HaloTag ligand and incubation with Alexa Fluor 594-EGF (Left; more than 10 cells in more than three biological replicates) are shown. Fluorescence intensity based on line-scan analysis around the circumference of representative endosomes (Right, indicated by arrows on Left) is also shown, reflecting the relative distributions of each ESCRT complex and EGF. (Scale bars: I and J, 500 nm; K, 1 μm.)

