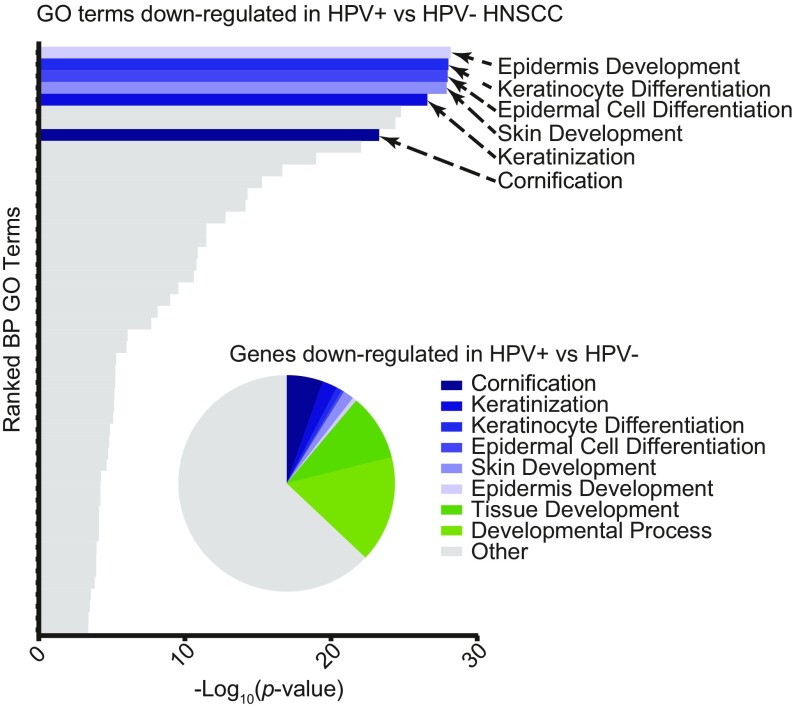
Fig. 8.
Keratinocyte differentiation gene signature describes the major differences between HPV+ and HPV− HNSCC. Data from HNSCC samples on the TCGA database were determined to be HPV+ or HPV− and analyzed for differences in gene expression. Bar chart portrays the ranked −log10(P values) of enriched GO terms among genes down-regulated in HPV+ HNSCC. Pie chart displays fraction of total down-regulated genes that fall into selected GO categories.

