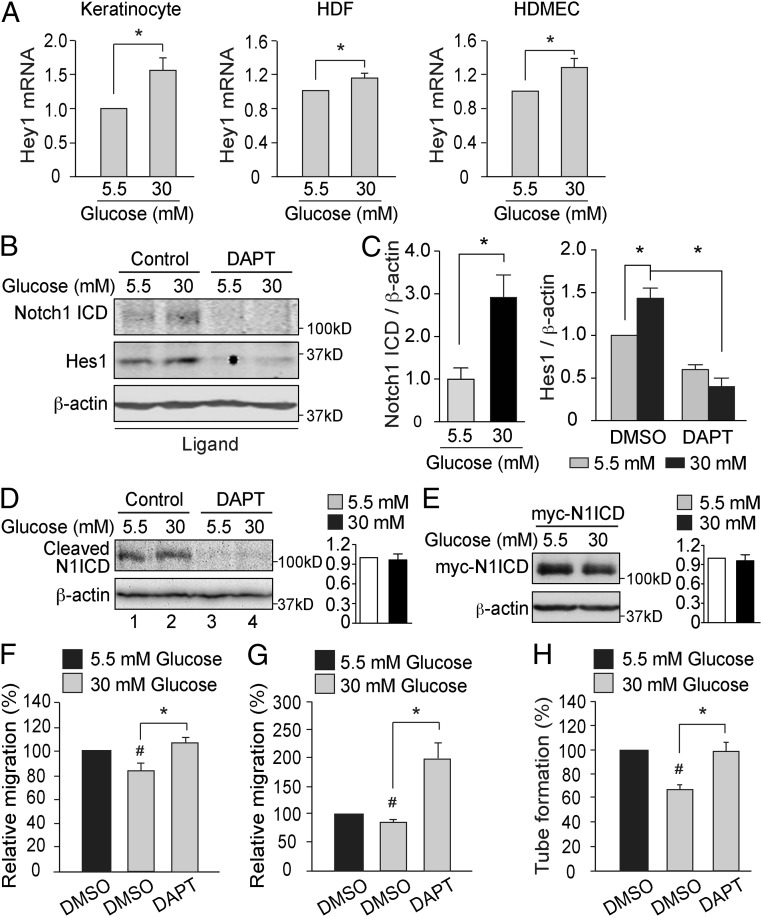
Fig. 3.
High glucose levels activate Notch1 signaling in vitro. (A) Primary human keratinocytes (n = 6), HDFs (n = 3), and HDMECs (n = 3) were exposed to 5.5 or 30 mM glucose for 24 h. Relative Hey1 mRNA expression levels are shown. *P < 0.05. (B and C) Endogenous Notch1 ICD (n = 4) and Hes1 (n = 3) protein levels in keratinocytes that were exposed to 5.5 or 30 mM glucose and treated with DMSO (control) or DAPT (10 µM) for 24 h. Quantification of Western blots are shown in C. *P < 0.05. (D) HDFs were transiently transfected with Notch1 ΔE, exposed to 5.5 or 30 mM glucose for 2 d, and treated with DMSO (Control) or 10 μM DAPT for 18 h before harvest. The cleaved product Notch1 ICD (N1ICD) was detected by using an antibody raised against activated Notch1. Quantification of N1ICD/β-actin is shown in the histogram (n = 3). (E) HDFs were transiently transfected with myc-tagged Notch1 ICD (myc-N1ICD) and exposed to 5.5 or 30 mM glucose for 2 d. Myc-N1ICD protein levels were detected by using an anti-Myc antibody. Quantification of myc-N1ICD/β-actin is shown in the histogram (n = 3). (F–H) Keratinocytes (F), HDFs (G), and HDMECs (H) were cultured in medium containing 5.5 or 30 mM glucose and exposed to DMSO or 10 μM DAPT for 24 h before the in vitro migration assay (F and G; n = 5) or in vitro angiogenesis assay (H; n = 3). #P < 0.05 (compared with cells exposed to 5.5 mM glucose); *P < 0.05 (compared with the corresponding controls).

